The previous system used to display all the columns in the pop-up display for LOV’s in terms of query or CSV and only the first value can be returned as a value. This new enhancement will let the user choose the columns that are displayed in the pop-up display of LOV’s and select a single value that can be used as a return value.
Navigation :
Login in to Web ->Go to Domains-> Edit Domain-> List of Values->Create.
Follow the steps below : :
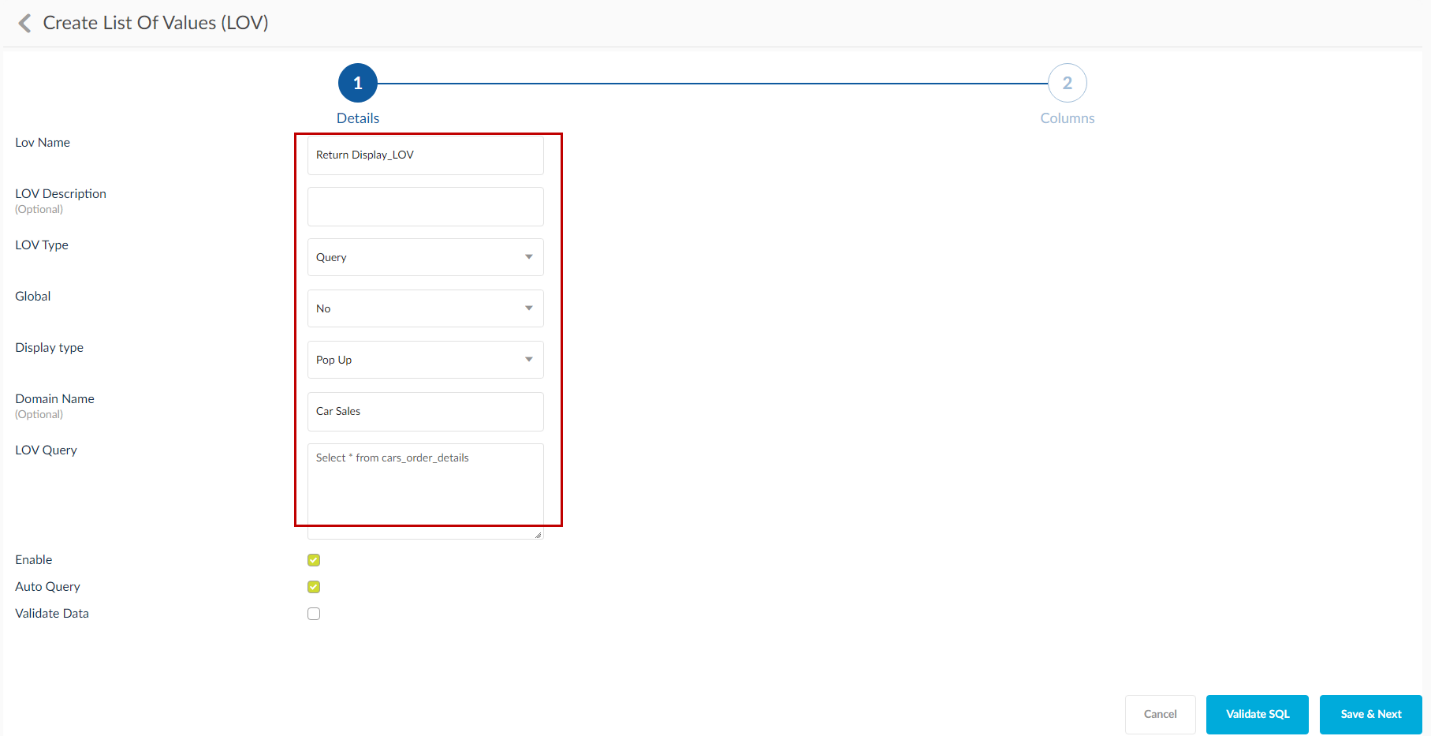
1. Mention the name of the LOV.
2. Change the LOV Type to query and change the display type to popup.
3. In the LOV Query text box, enter the query and click Validate SQL.
4. Click Save & Next.
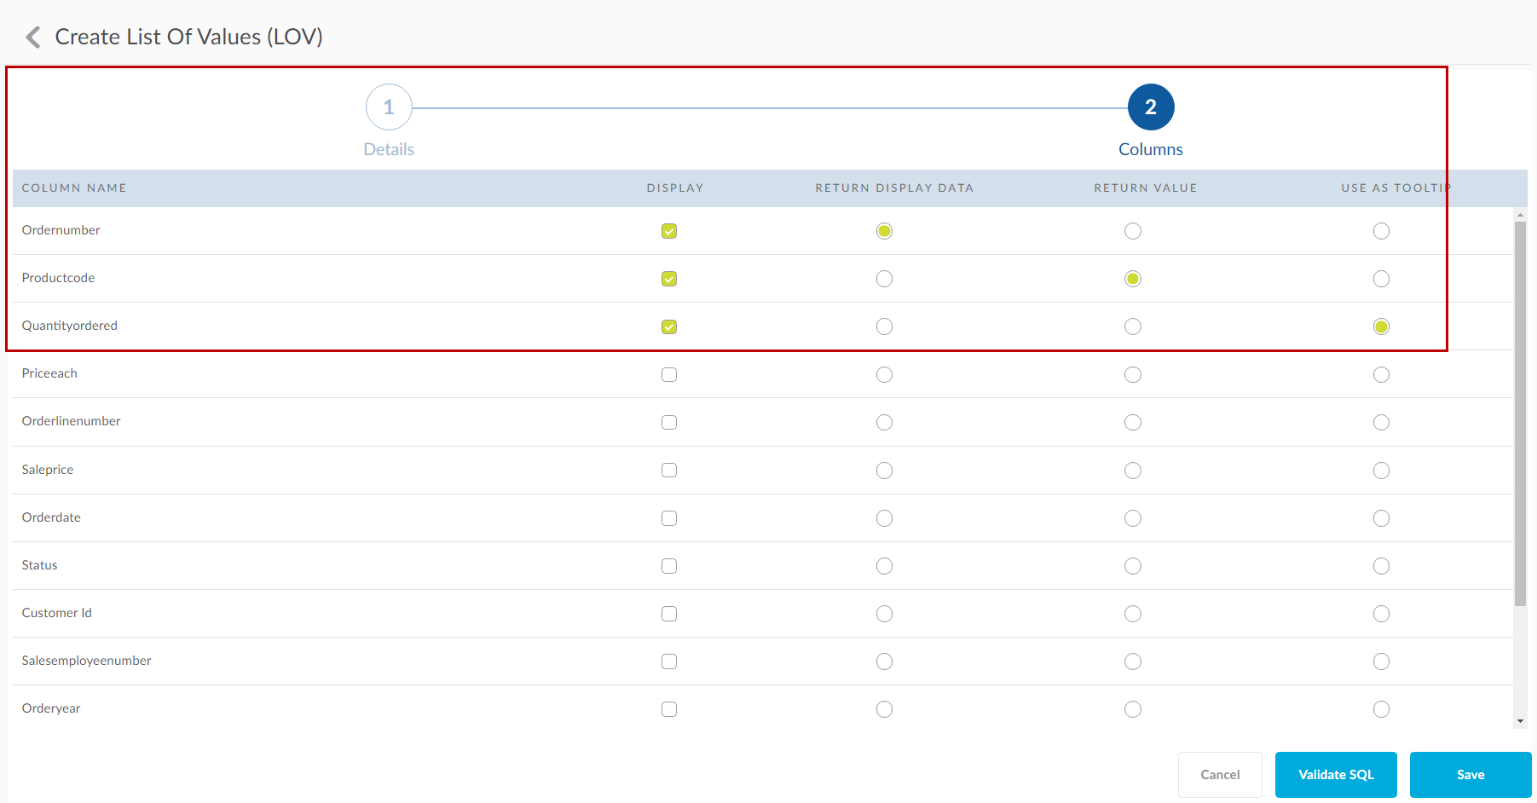
5. Select any three that are required as Return Display Data, Return Value and Use As Tooltip.
• Return Display Data: This will be the default return data that is displayed when the user selects an LOV.
• Return Value: This is the value that is returned when the report is run.
• Use As Tooltip: When the user hovers the mouse over the return display data, this value is displayed.
6. Click Save.
7. Login in to SplashBI Excel Connect.
8. Go to Reports and click Create.
9. Select the same domain on which LOV was created.
10. Move the columns from the table. The user should note that using the same table that is used in the LOV query will yield better results. Here, for example, the order details table is used.
11. In filters, select the List of Values tab and from the List of Values Source drop-down, select LOV Name as the option
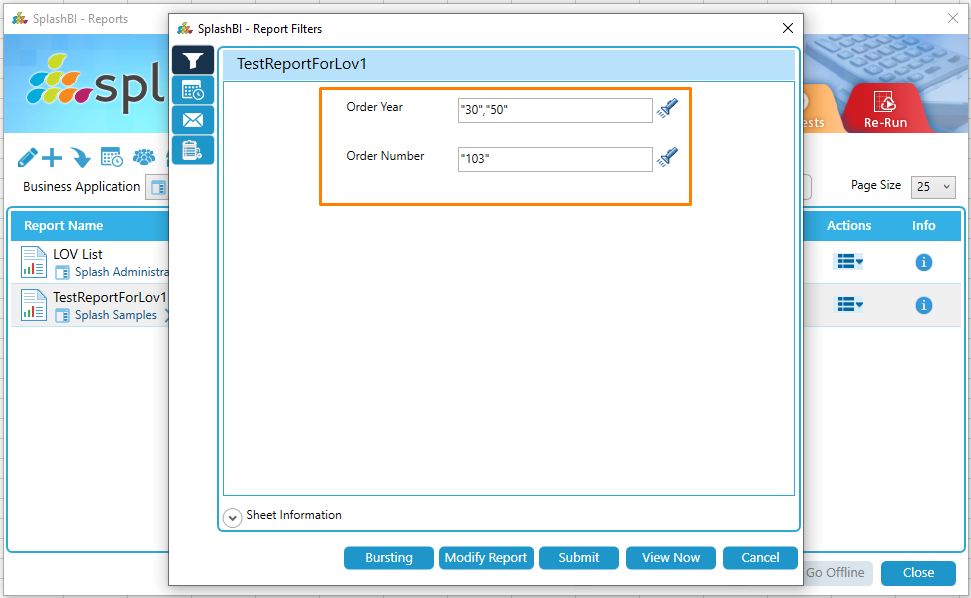
12. When the user clicks Submit, the Return Value is displayed in the SQL and in the report information.