Charts
A chart is a visual representation of data which allows you to analyze and interpret data. In SplashBI, a chart is also what will primarily make up a dashboard. SplashBI offers a wide range of customization options to build your charts to your individual needs, including Titles, Colors, Legends, Tool Tips, etc. SplashBI also provides comprehensive filtering capability to filter the data that you wish to see in the charts.
![]() : Run icon
: Run icon
![]() : Favorite icon
: Favorite icon
![]() : Information icon
: Information icon
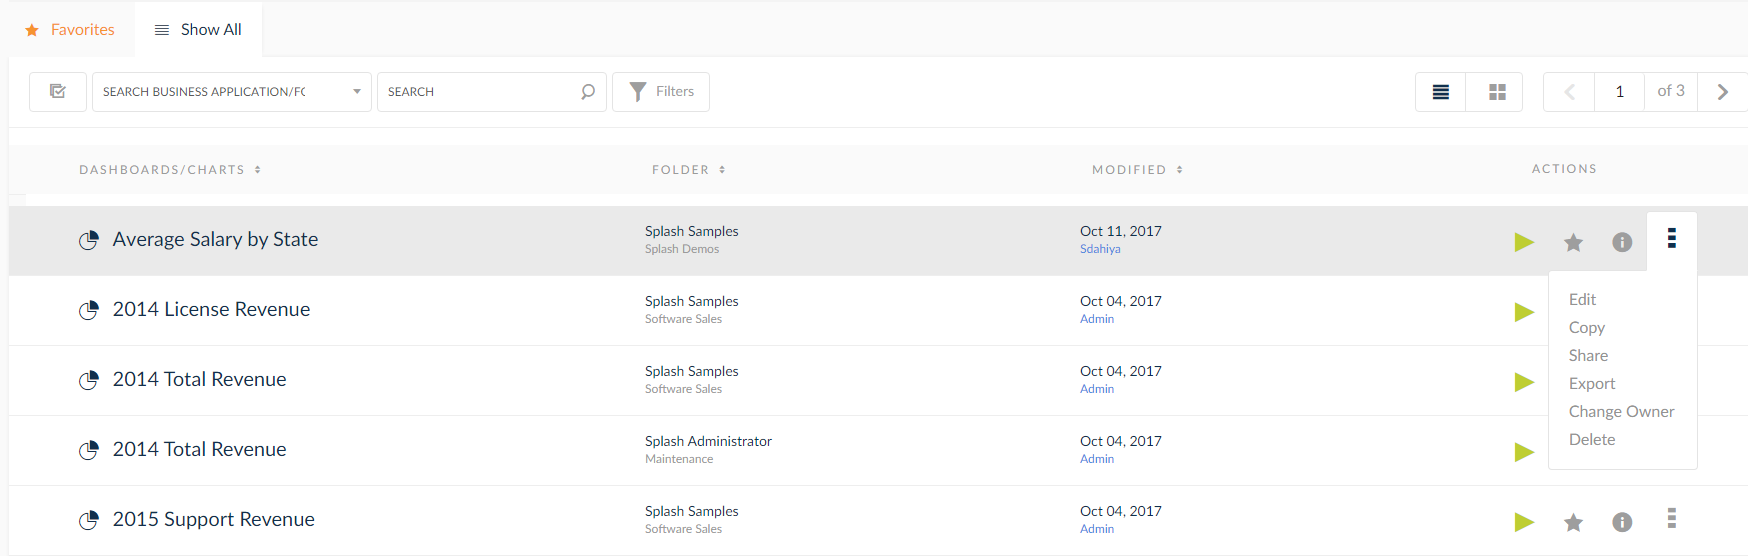
- To edit the selected chart, click the
 icon found on the same line, then click Edit. This option will bring user back to the edit chart page if it is chart.
 - To copy a specific chart, click the
 icon found on the same line, then click Copy . This function will copy the formatting and customization of a particular chart.
 - To search for a specific chart by name or specific dashboard by name, use the search-bar function.
 located at the top of the page.
- To search for a specific chart by folders or business area, use search by folders/business area search text box
 located at the top of the page.
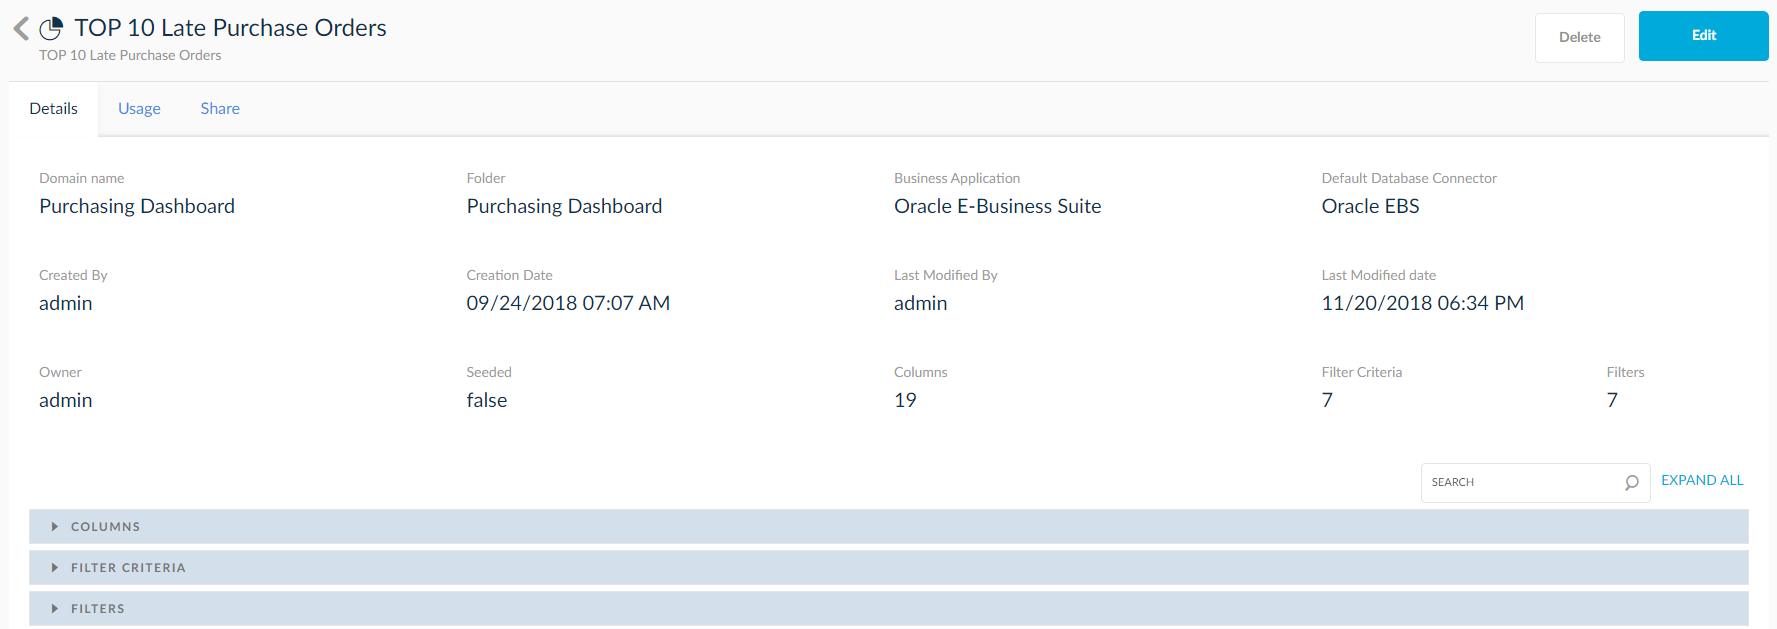
- Info
 icon displays details in other page like Created By, Creation Date, Seeded, Last Modified Date and Last Modified By etc., below the selected chart.
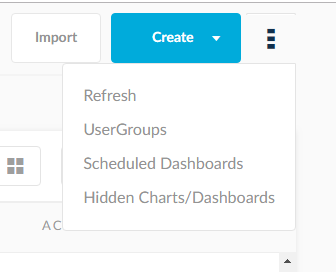
- View user groups by clicking User Groups.
- Refresh the entire page by clicking Refresh.
- View the Scheduled Dashboards by clicking on Scheduled Dashboards.
- View Hidden Charts/Dashboards by clicking on the text as shown below.