Terminologies
This page gives an insight into the various technical terms used in SpalshBI.
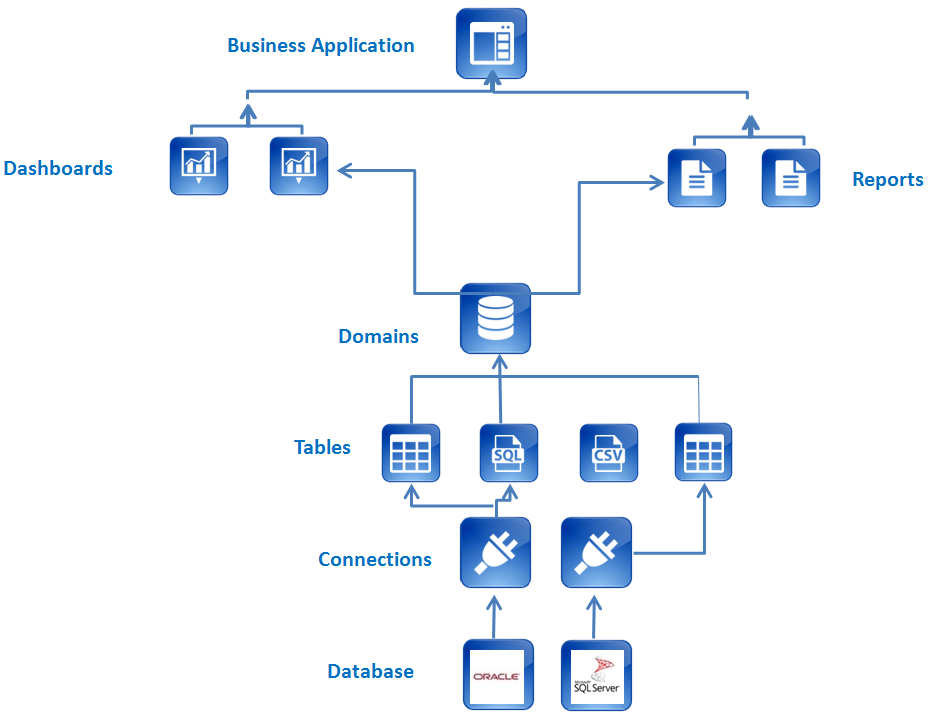
- Business Application: Business Application is a System or Application or a Project and is the highest entity in the reports/dashboards hierarchy.
- Folders: A collection of related Reports or Dashboards. Best practice is to have the same name as Domains.
- Dashboard: A dashboard is like a frame where all the charts you have created can be placed for viewing and analyzing.
- Chart: Graphical representation of data from tables of a Domain.
- Reports: Tabular display of specific data within the organization.
- Measure: Measure is a property on which calculations (e.g., sum, count, average, minimum, maximum) can be made on numeric fields. Also known as Fact or Data Point or Values (in Excel Pivot). Used only in Charts.
- Dimension: Dimension is a structure that categorizes Measures and is always a text field. Used only in Charts.
- Table: Table is a collection of related columns and is derived from a database table or a file or a SQL.
- Domain: Domain is a SplashBI term that represents the tables/objects derived from a database related to a specific area. A domain may consist of tables from different connections.
- Connection: Connection to an external database or data source.
Reports/Dashboards Hierarchy
SplashBI Reports can be categorized into Folders. Folders can be categorized into Business Areas. Reports organizes all the information into alphanumeric order by the report name. Report is a tabular display
of specific data from tables of a Domain.
