Web Pivot Output
Click pivot graph to open a pivot graph in your browser. The pivot tables defined in the report will show up in the Pivot graph format. The pivot options can be instantly changed on the output. Double clicking on on any of the item will open them in a separate pop-up.
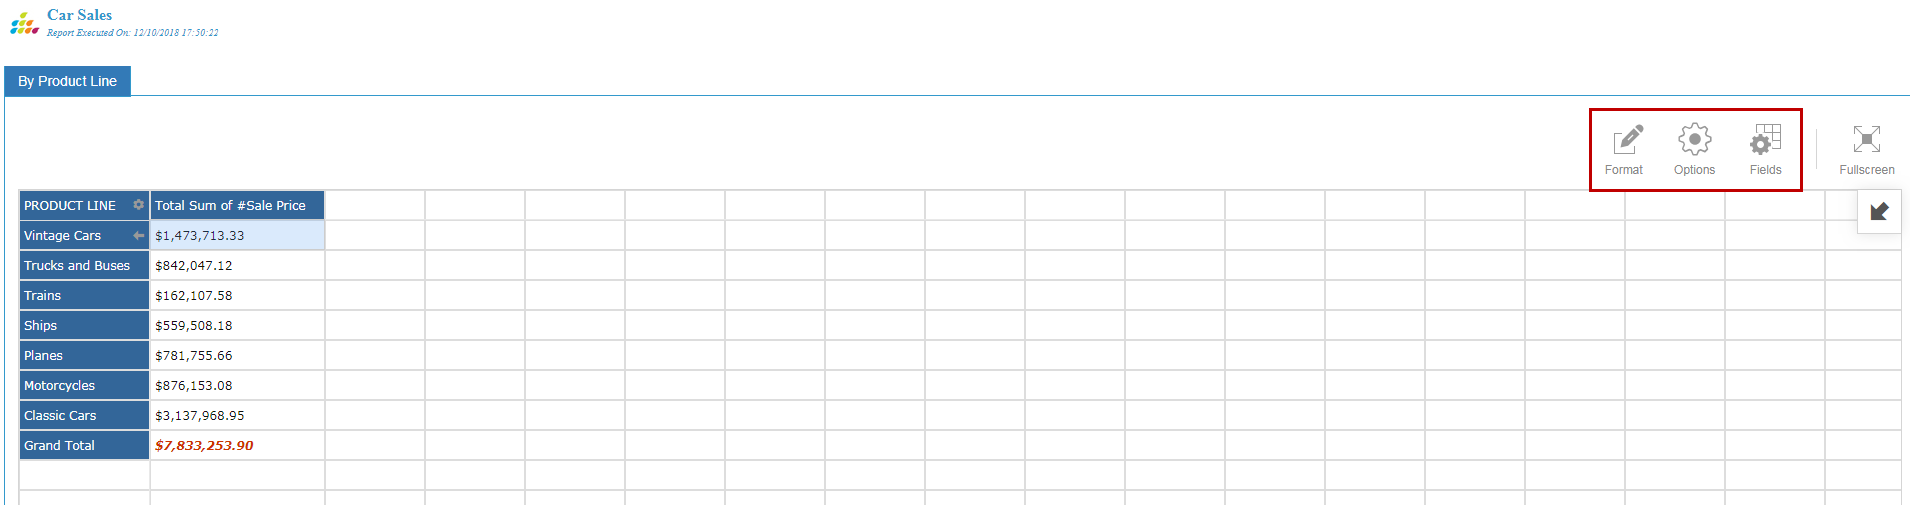
There are three major options present:
- Format: You have the options to Format Cells and Conditional Formatting.
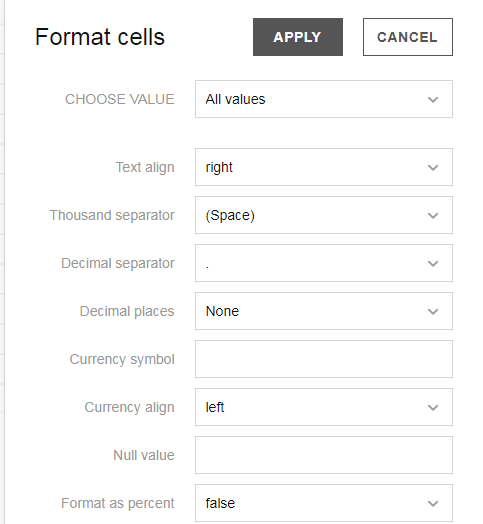
- Format Cells: Clicking this option will display a pop-up with options for formatting the cells.
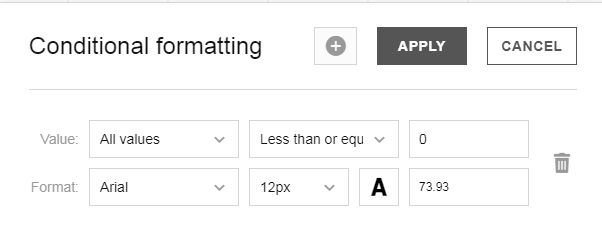
- Conditional Formatting: Clicking this option will display a pop-up with conditions that can be applied to the cells for filtering. Options include font size, color, style value filtering.
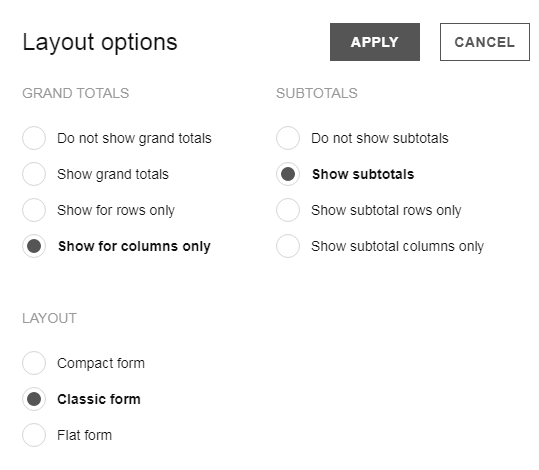
- Clicking on Options will display the layout options.
- Clicking on Fields will display a pop-up where you can add additional fields to the columns. Clicking on the Sigma icon in the Values box will display a drop down with functions like Sum, Count etc.
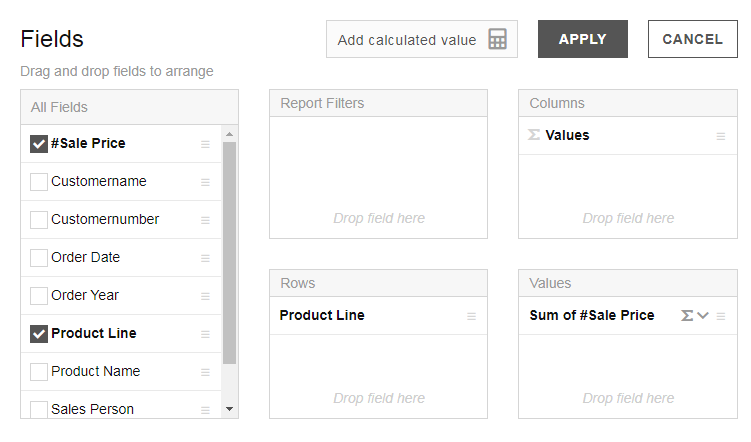
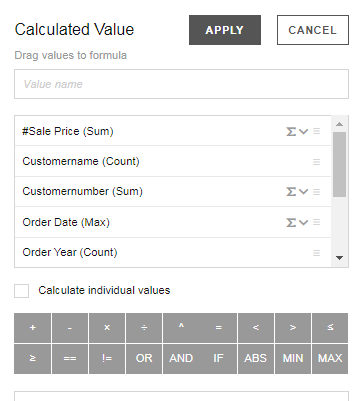
- Click the Add calculated value to display a pop-up where you can create your own column values through available operators.