Creating Dashboards
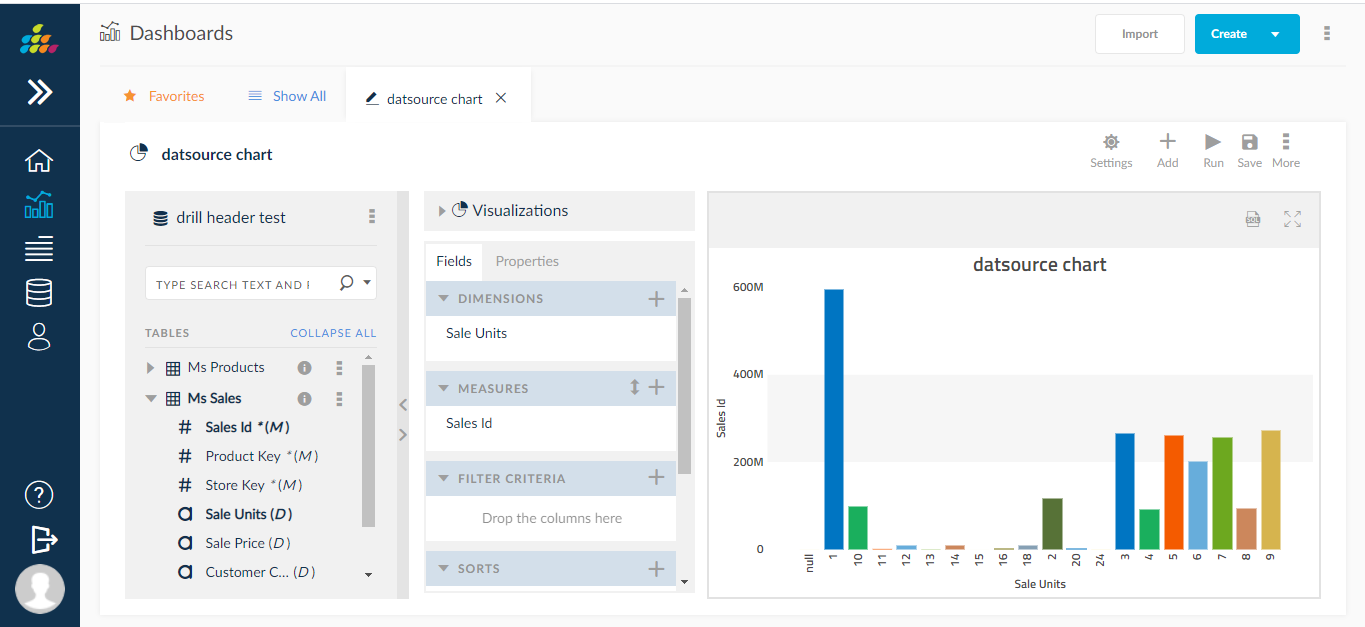
Dashboards utilize user charts to illustrate the data and information of an organization. Dashboards can be easily created or edited to include new charts, rearrange, resize and modify parameters.
Customize your dashboard to include widgets that provide information at a glance.
To create a new dashboard, click the ![]() icon at the top of the screen, then click Dashboard in slide down.
icon at the top of the screen, then click Dashboard in slide down. 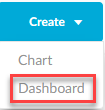
Clicking the Create Dashboard icon will redirect you to the Configure Dashboard screen.
Screen Layout
- Adding Charts
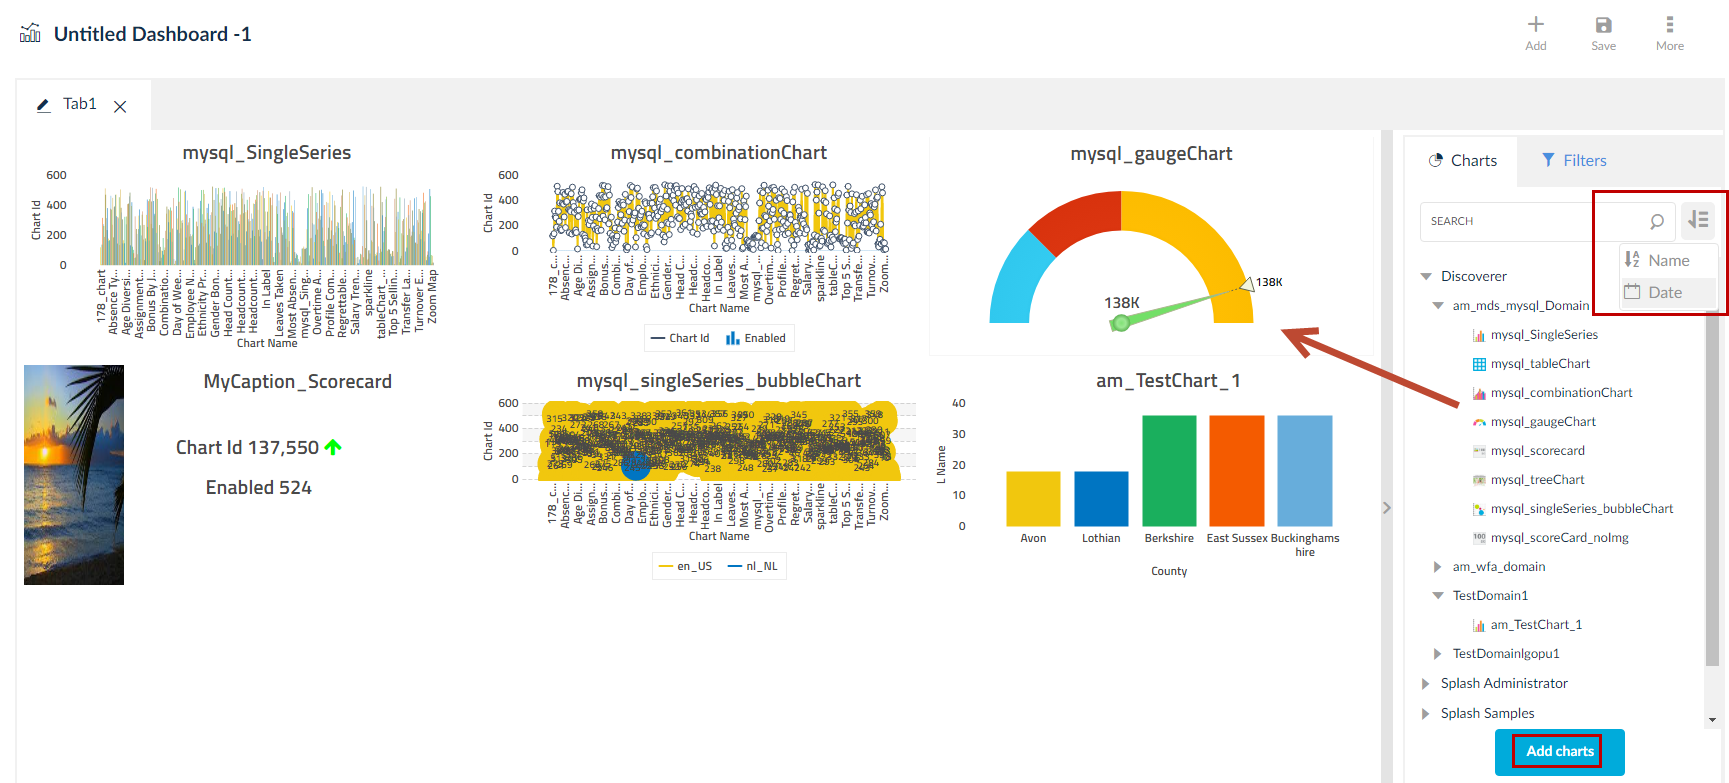
- Begin by selecting the domain through the drop-down. The domains drop-down will display all available domains you have access to. Once a domain is selected, the available charts will be displayed as shown below.
- Search for specific charts or chart groups by using the search field under domains. Once a chart has been selected, the user will click and drag the chart name to the center section to add the chart to the dashboard.
- Charts can be resized with the handle on the bottom right of the chart, and can be moved and rearranged by clicking and dragging within the chart.
2. Add additional tabs, images and text to your dashboard, providing further depth to the visual data. Additionally, you can modify the dashboard layout design.
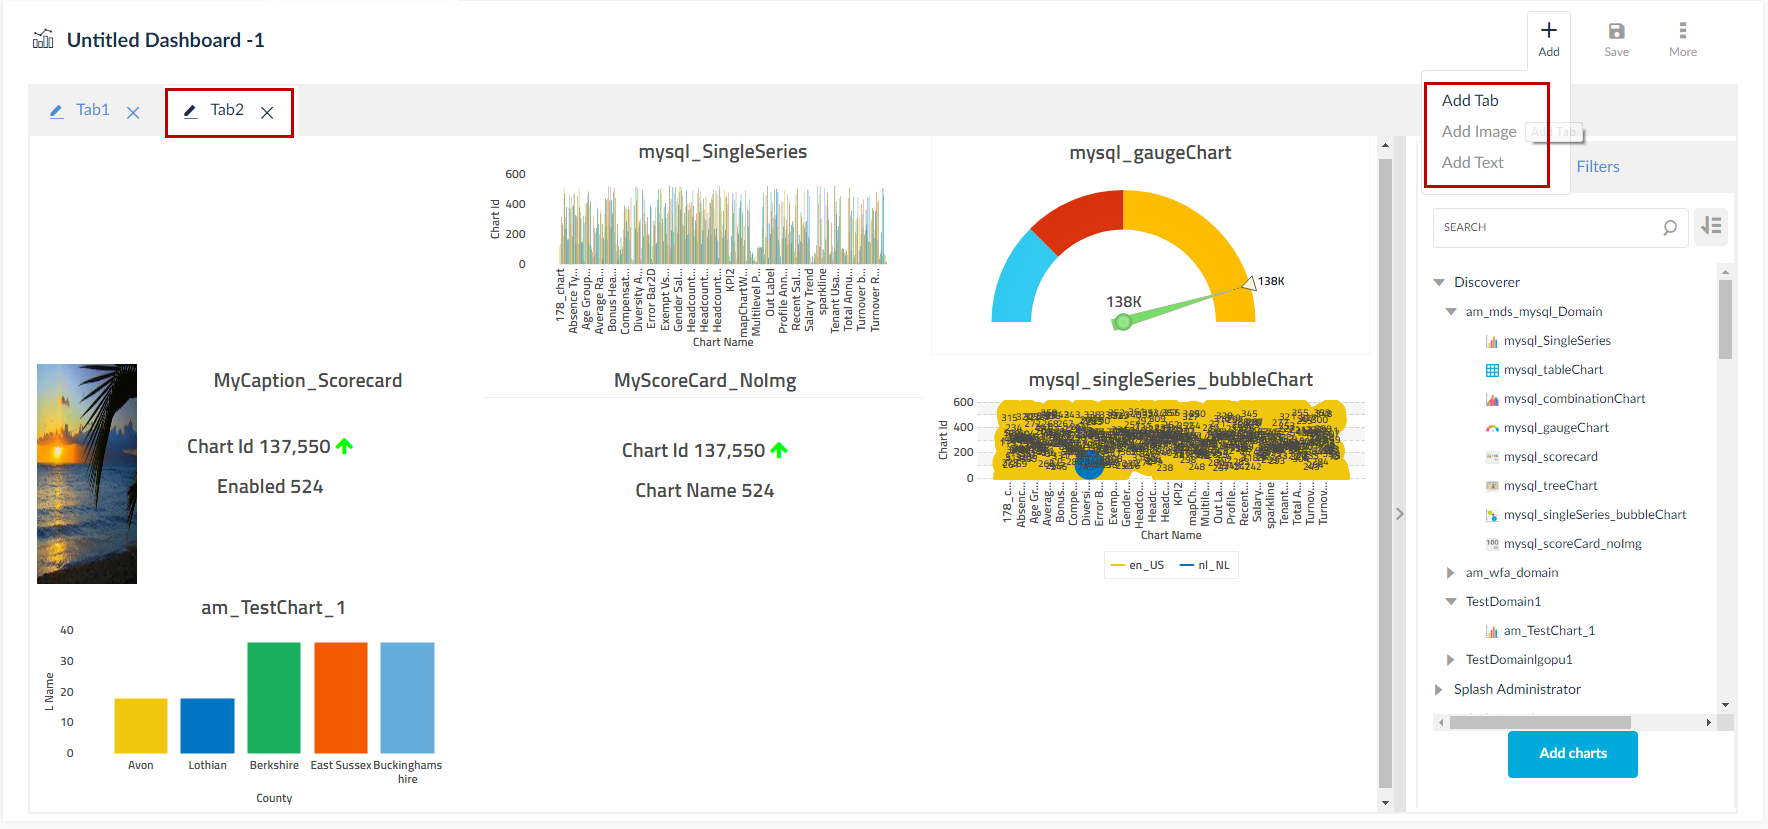
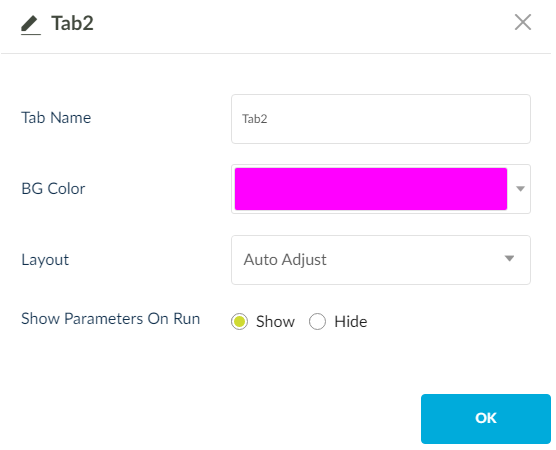
Click on the pencil icon to configure the tab.
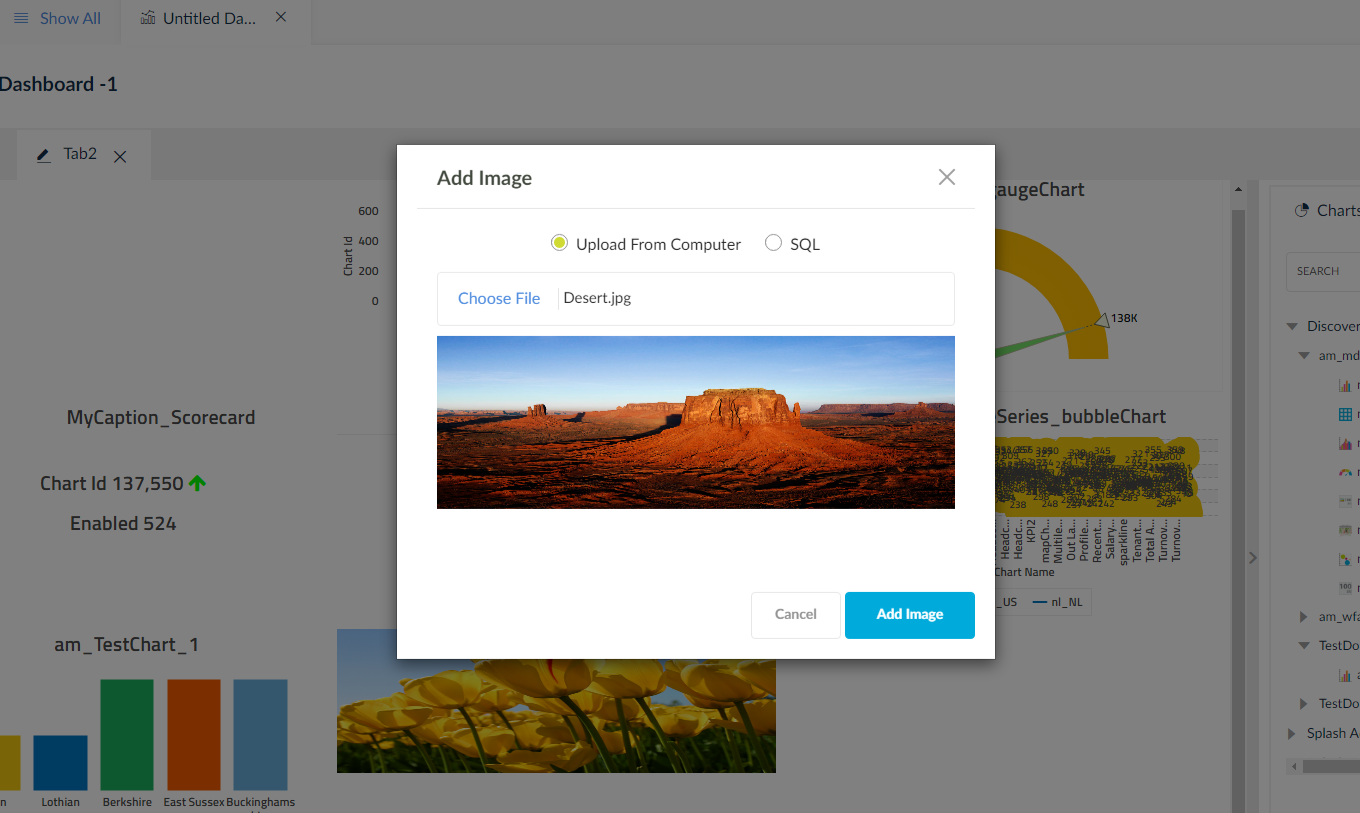
Add Image
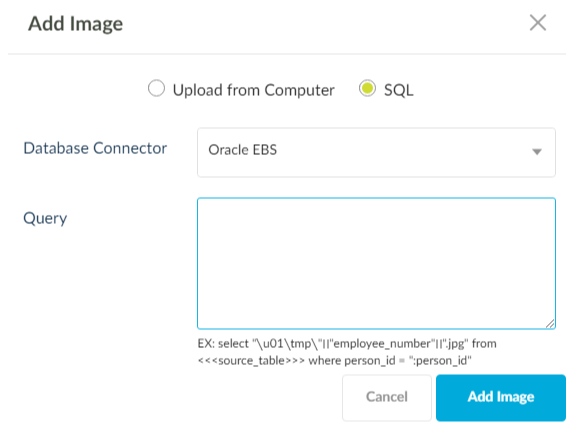
Add images to the dashboard either through direct upload from the local path or through a SQL Query.
Upload dashboard images through a SQL query and based on the filter values the image is loaded.
The below query is a sample SQL query.
select <<Local path>> from <table name> where <column name>="<:value>"
Add Text
Clicking this will open a new text box in the dashboard where you can type any text.
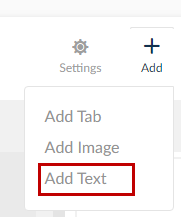

You have all the text formatting options available and you can also expand and delete the text box.
4. Add Charts to dashboard option enables you to select multiple charts at a time.
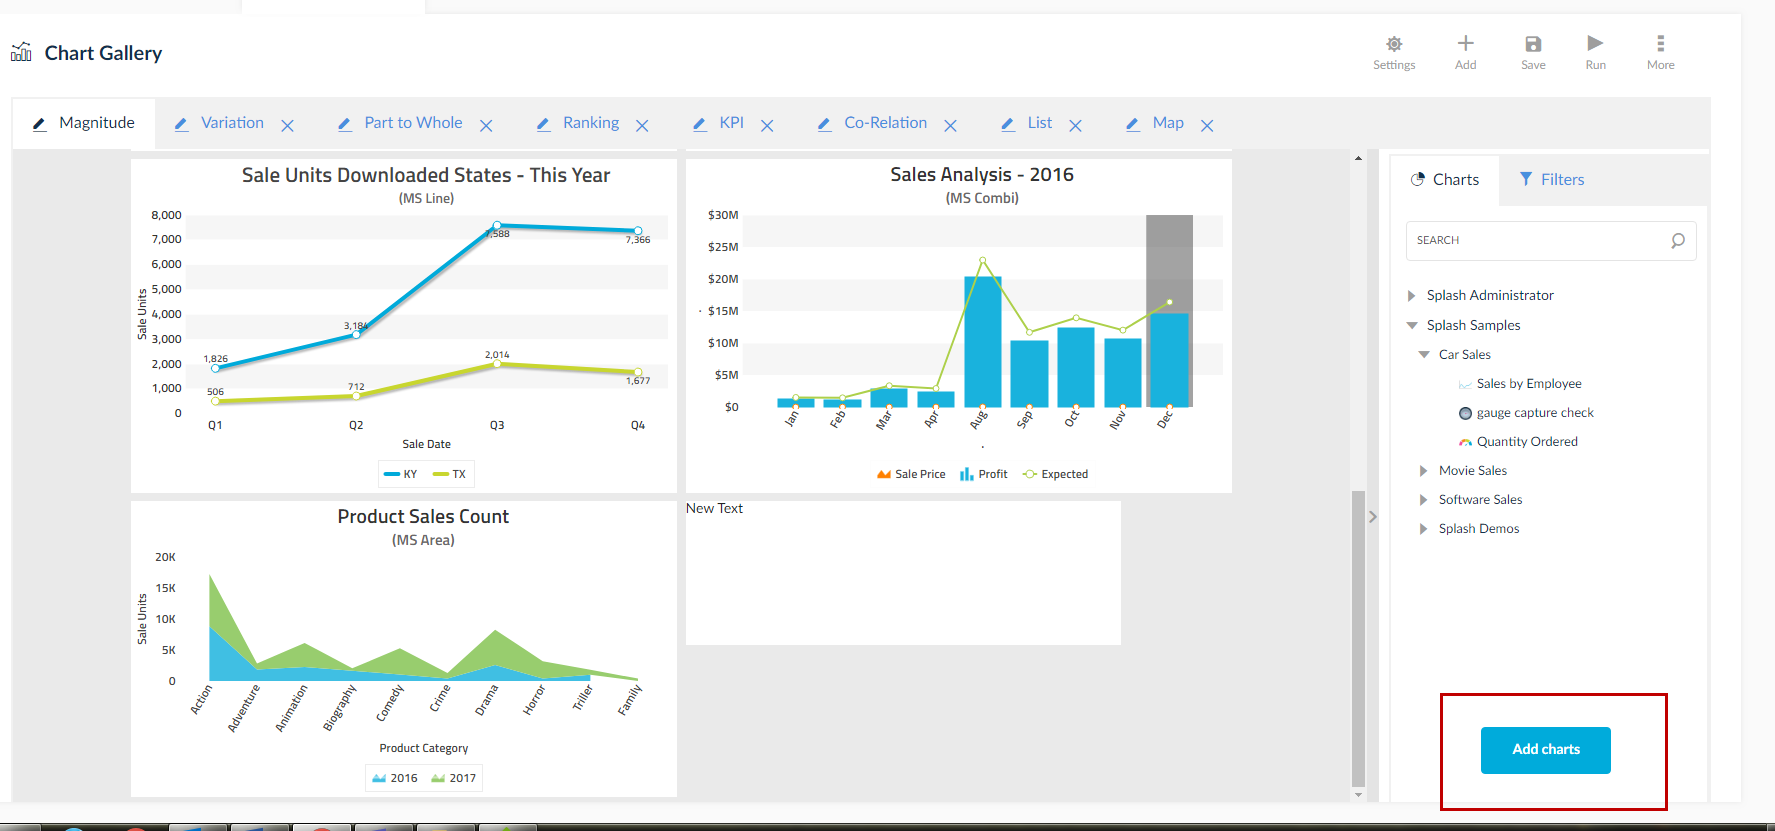
NOTE:
- You can customize the Configure Dashboards screen by hiding or expanding both the left hand chart selection window and the parameters section.
- Only the parameters section will be visible to you when running the dashboard.
5. Click the ![]() button at the top to save the dashboard.
button at the top to save the dashboard.
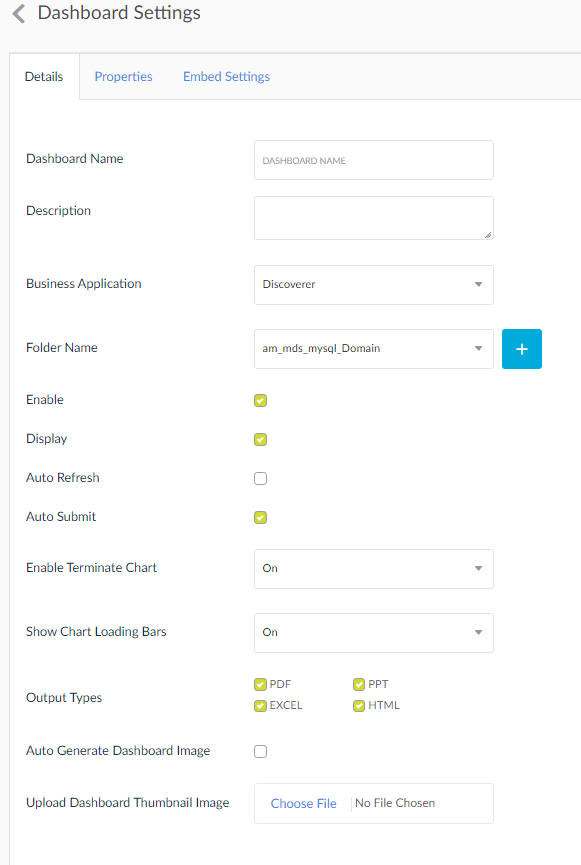
A few fields explained:
- Auto Refresh: Checking this option will auto refresh the dashboard if any inputs to the chart data is done.
- Enable Terminate Chart: Selecting On will enable the option to terminate chart.
- Show Chart Loading Bars: Selecting On will show the loading bars icon.
- Auto Generate Dashboard Image: Checking this option will display a dashboard image automatically.
- Upload Dashboard Thumbnail Image: Choose the image that will be displayed as the dashboard image.
Editing Dashboards
To edit a previously created dashboard, look for the ![]() icon that can be found in the dashboards list view, grid view.
icon that can be found in the dashboards list view, grid view.
In the dashboard list view, the edit ![]() icon can be located on the to be modified item line corresponding with the dashboard.
icon can be located on the to be modified item line corresponding with the dashboard.

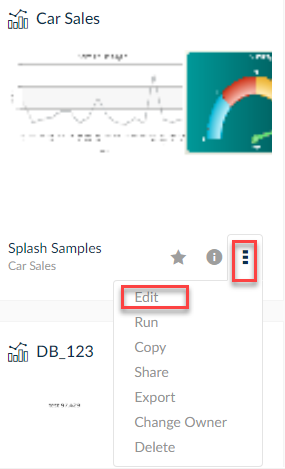
- When in the dashboard grid view, click the
 icon and click Edit.
- To edit a dashboard after the dashboard has been run, click the
 icon located at the top of the screen, then click Edit in the slide down. To learn how to run a dashboard, click here.
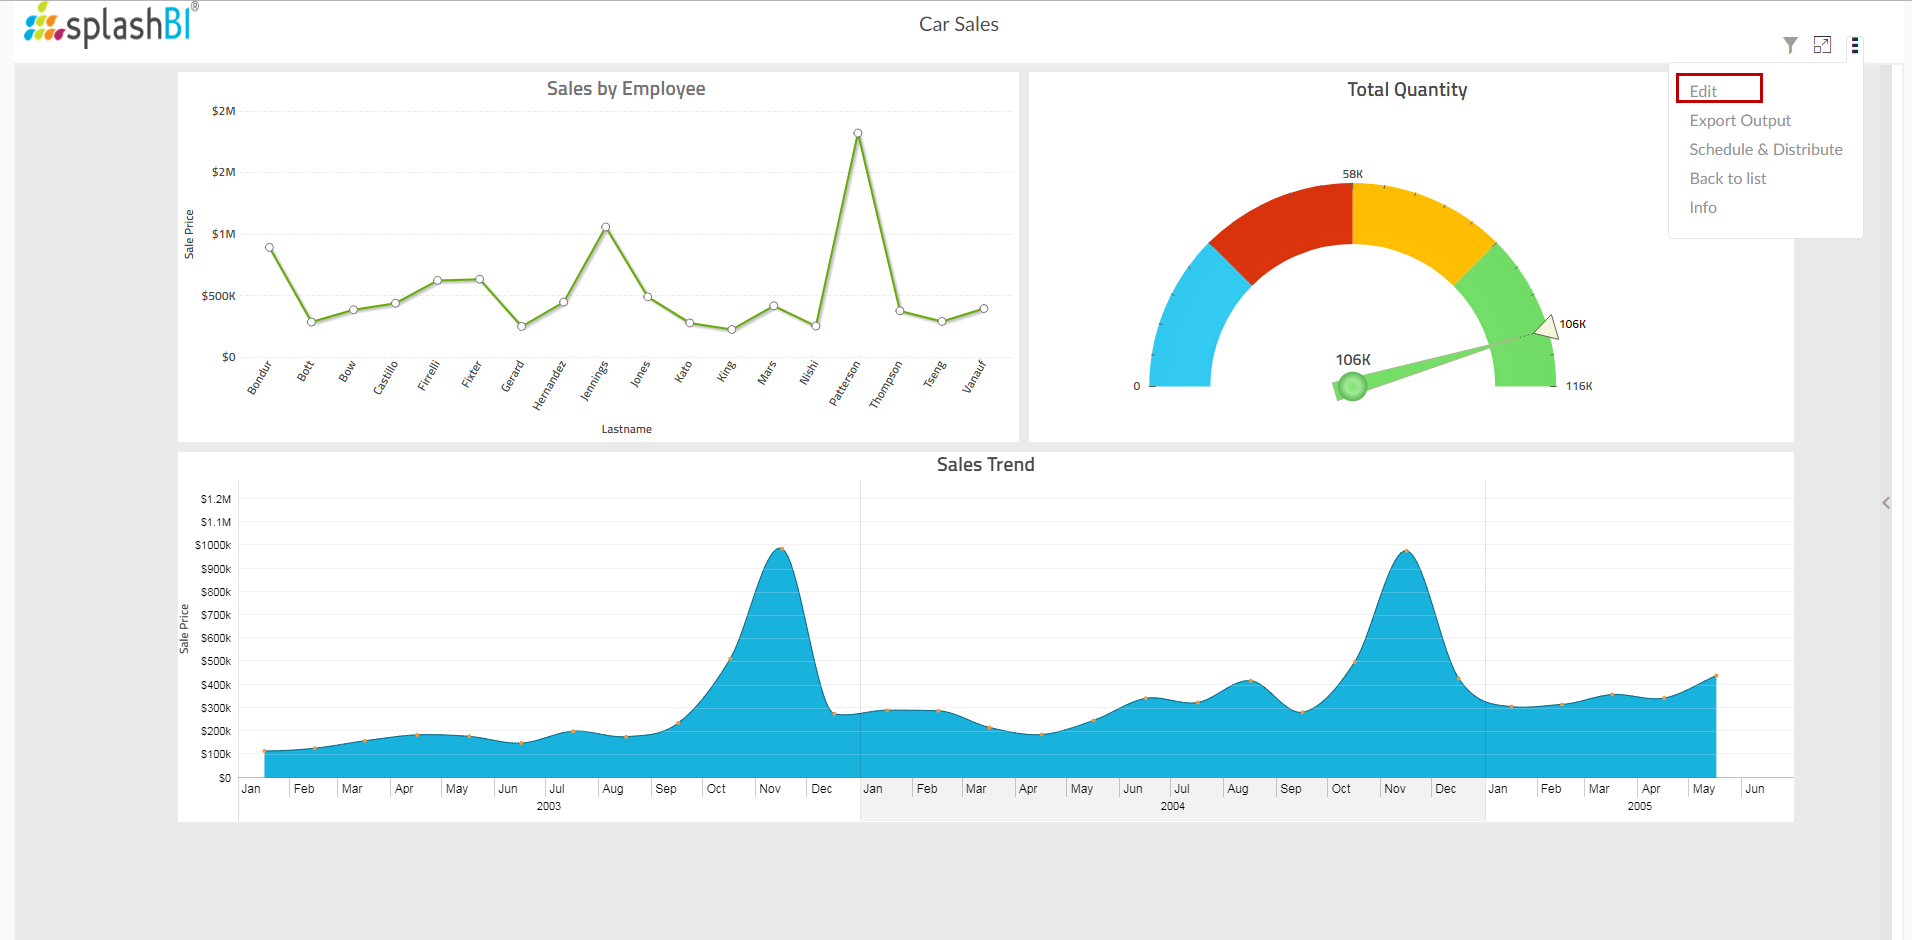
- Each option to edit the dashboard will redirect you to the Configure Dashboard screen.
Dashboard Action Items
 Full Screen: Presents the dashboard without the web browser borders. Effectively used in presentation scenarios.
 - Edit: Redirects you back to the dashboard configuration screen.
- Export Output: Exports the dashboard into a multiple file formats. To learn more, click here.
- Schedule/Distribute Dashboard: Allows you to email the dashboard to specific users and user groups. To learn more, click here. You can also Schedule the dashboard.
- Info: Displays the information about the dashboard.
First driving table Should Be Expanded
After editing the dashboard, always first table in the Data source screen among multiple tables should be expanded by default.
