Report Aggregation
Data aggregation is any process in which information is gathered and expressed in a summary form for purposes such as statistical analysis. In SplashBI, determine a specific aggregation applied to particular data columns by clicking ![]() icon.
icon.
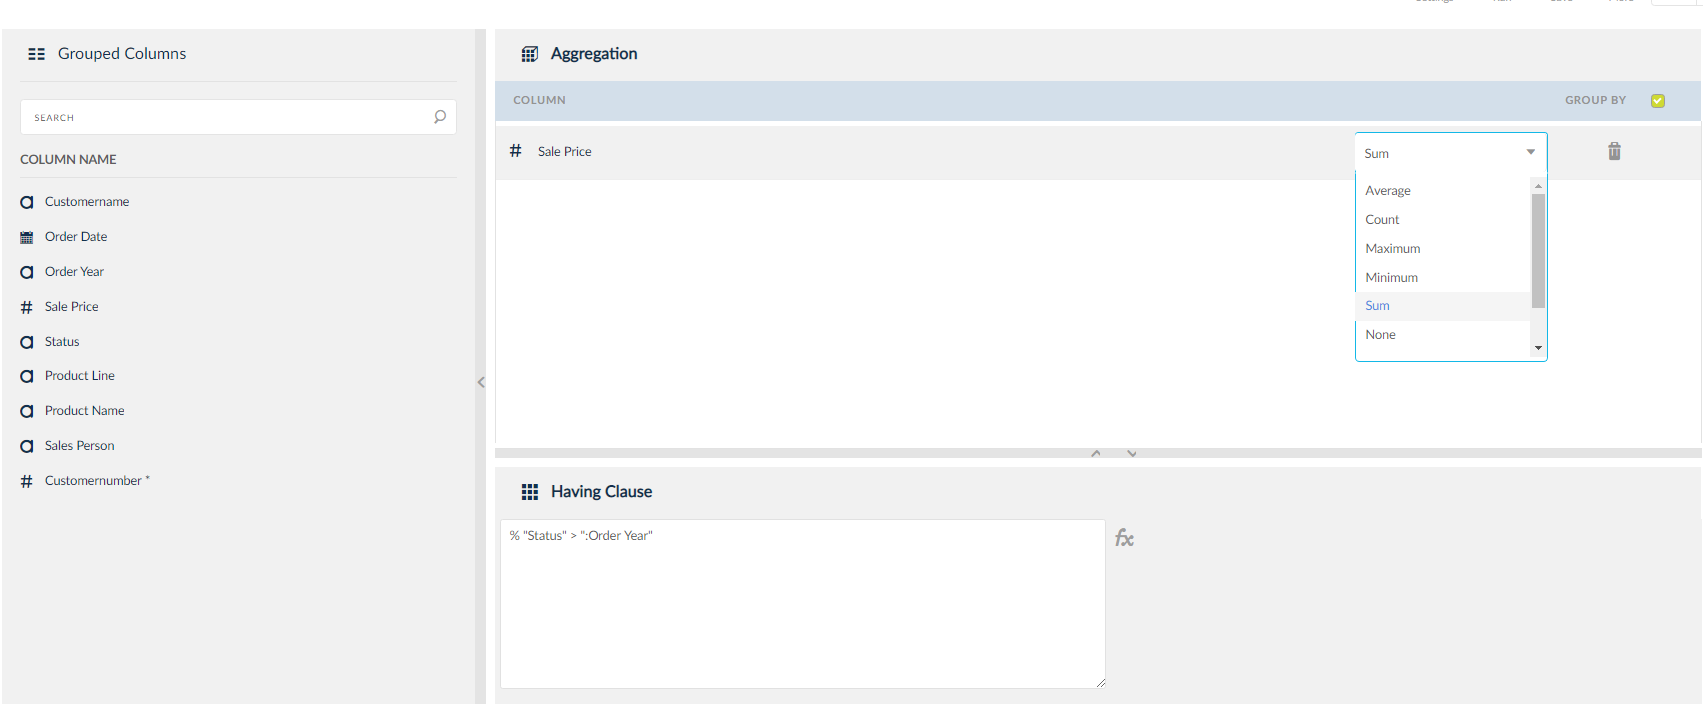
Drag and drop column data into the aggregation window, the drop down menu contains multiple operators to set up aggregation. The operators are:
- Average (AVG)
- Count
- Maximum (MAX)
- Minimum (MIN)
- None
- Sum (of all data)
- Sum (Distinct)
- Count (Distinct)
NOTE: For column names containing alpha data, the drop down options are: Count, None and Count (Distinct).
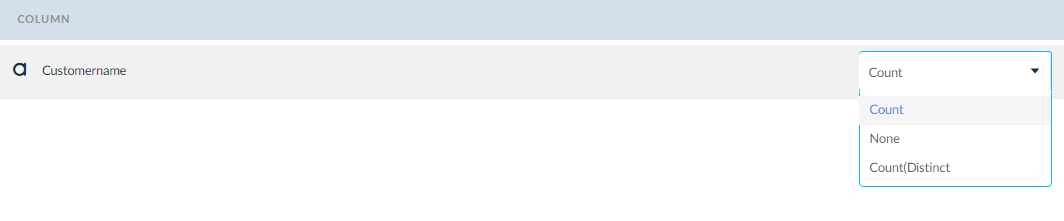
- Count: Counts the number of entries in the column and returns the value.
- None: Performs no action.
- Count (Distinct): Performs the count leaving aside duplicates.
For Date values the Aggregation values are:
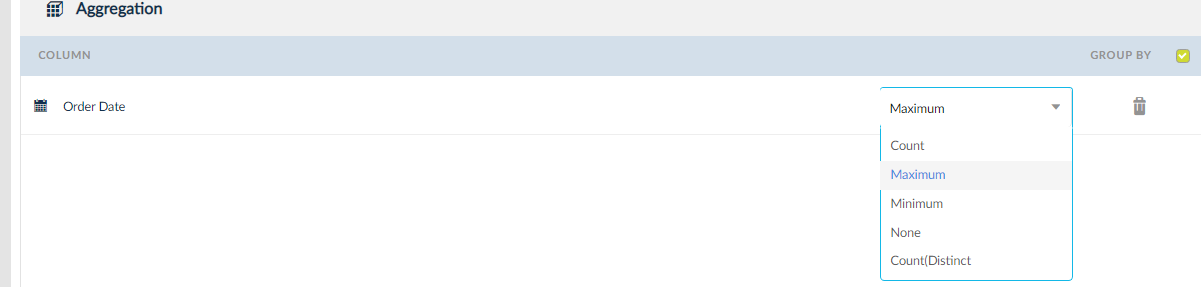
- Count: Counts the orders with a particular date.
- Maximum: Returns the maximum amount of orders on a particular date.
- Minimum: Returns the minimum amount of orders on a particular date.
- None: Performs no action.
- Count (Distinct): Eliminates duplicate values.
NOTE: Adding any one column to aggregation columns list will set the Group By Flag to true (check box will be checked). Deleting all the columns from aggregation columns list will set the Group By Flag to false (check box will be unchecked).