Creating Reports
This section describes creation and maintenance of the created reports. Create vibrant reports with a simple user interface on consistent basis.
Creating a Report
To create a report:
- Click the
 icon on the left side of the screen.
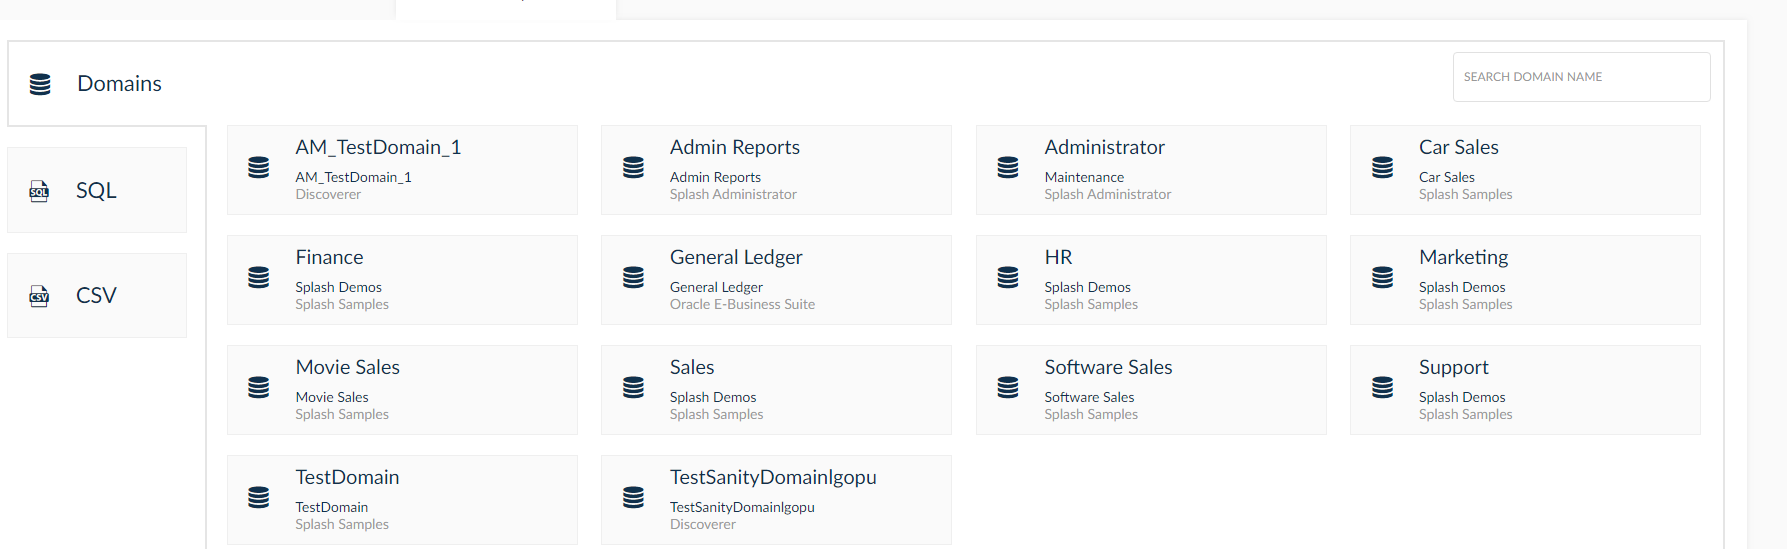
 - From the available domains list, select the data source on which the report will be based. Alternatively, select the SQL option and mention the Table Name, Database Connector, Domain and Query.
NOTE: You can pass the dependent report/chart filter name to the query. Please suffix the report or chart filter name with the respective data type value.
Ex: “:DateParam” /*DATE*/ . It is mandatory to provide a “DATE” suffix for the date data type. Similarly, “NUMBER“ for number data type & “TEXT” for varchar but both of these are optional.
Limitation: Self LOV option for List of Values source will not work for the dependent reports on this table. Instead, use query or LOV Names based List of Values source for the report/chart filters.
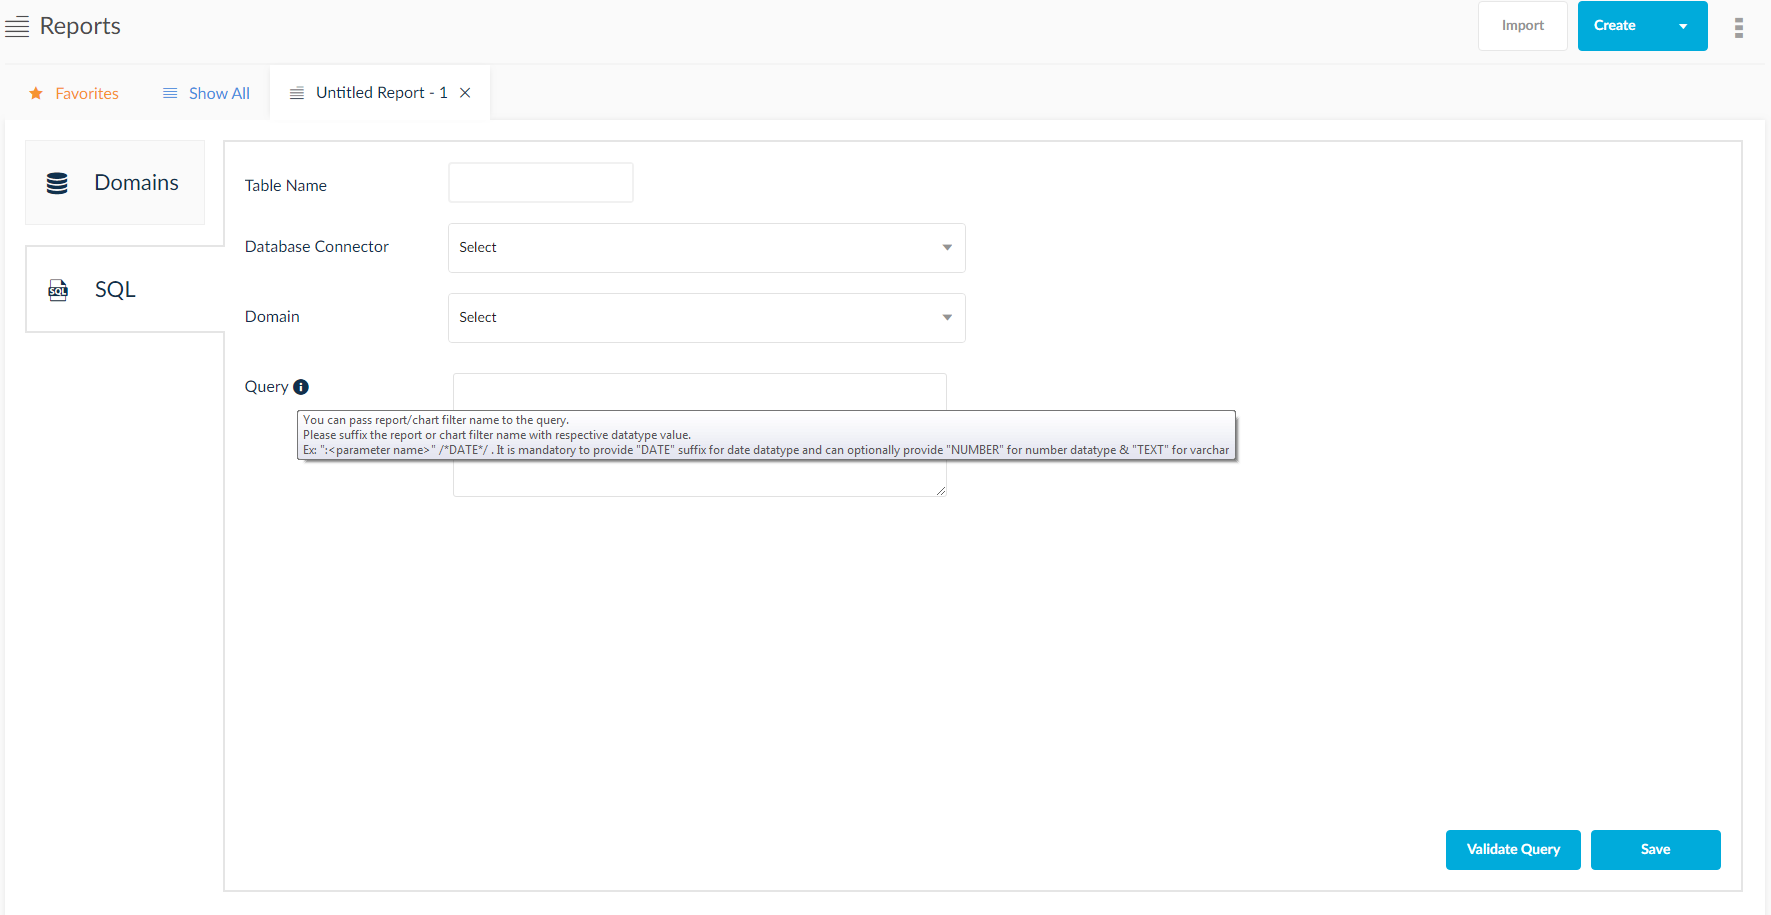
You can pass the dependent report/chart filter name to the query. Please suffix the report or chart filter name with the respective data type value.
Ex: “:DateParam” /*DATE*/ . It is mandatory to provide a “DATE” suffix for the date data type and can optionally provide “NUMBER” for number data type & “TEXT” for varchar.
These options are can be viewed in the report creation and SQL based tables in the domain section.
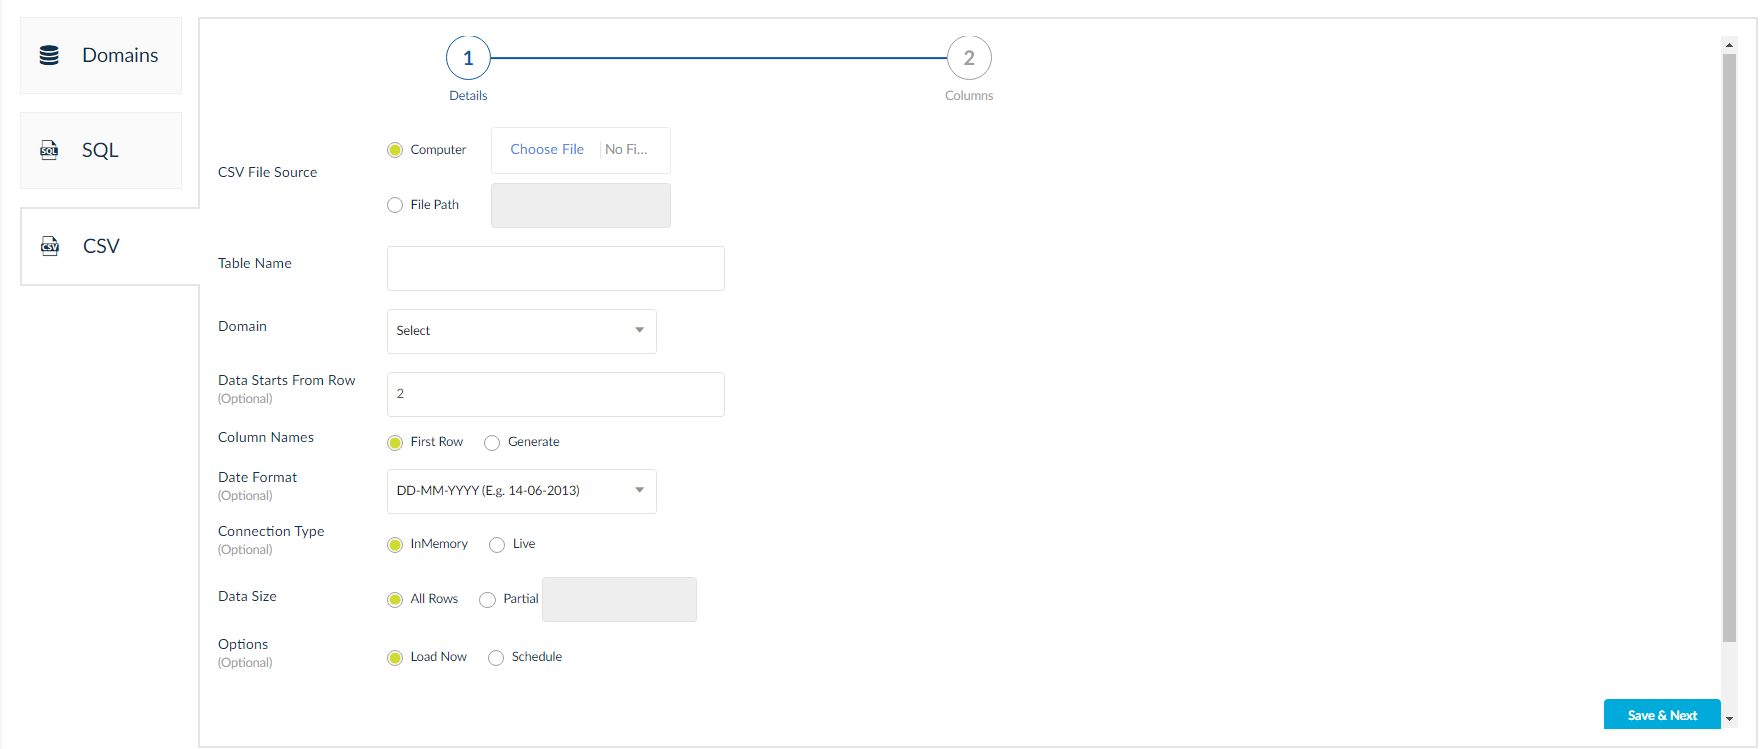
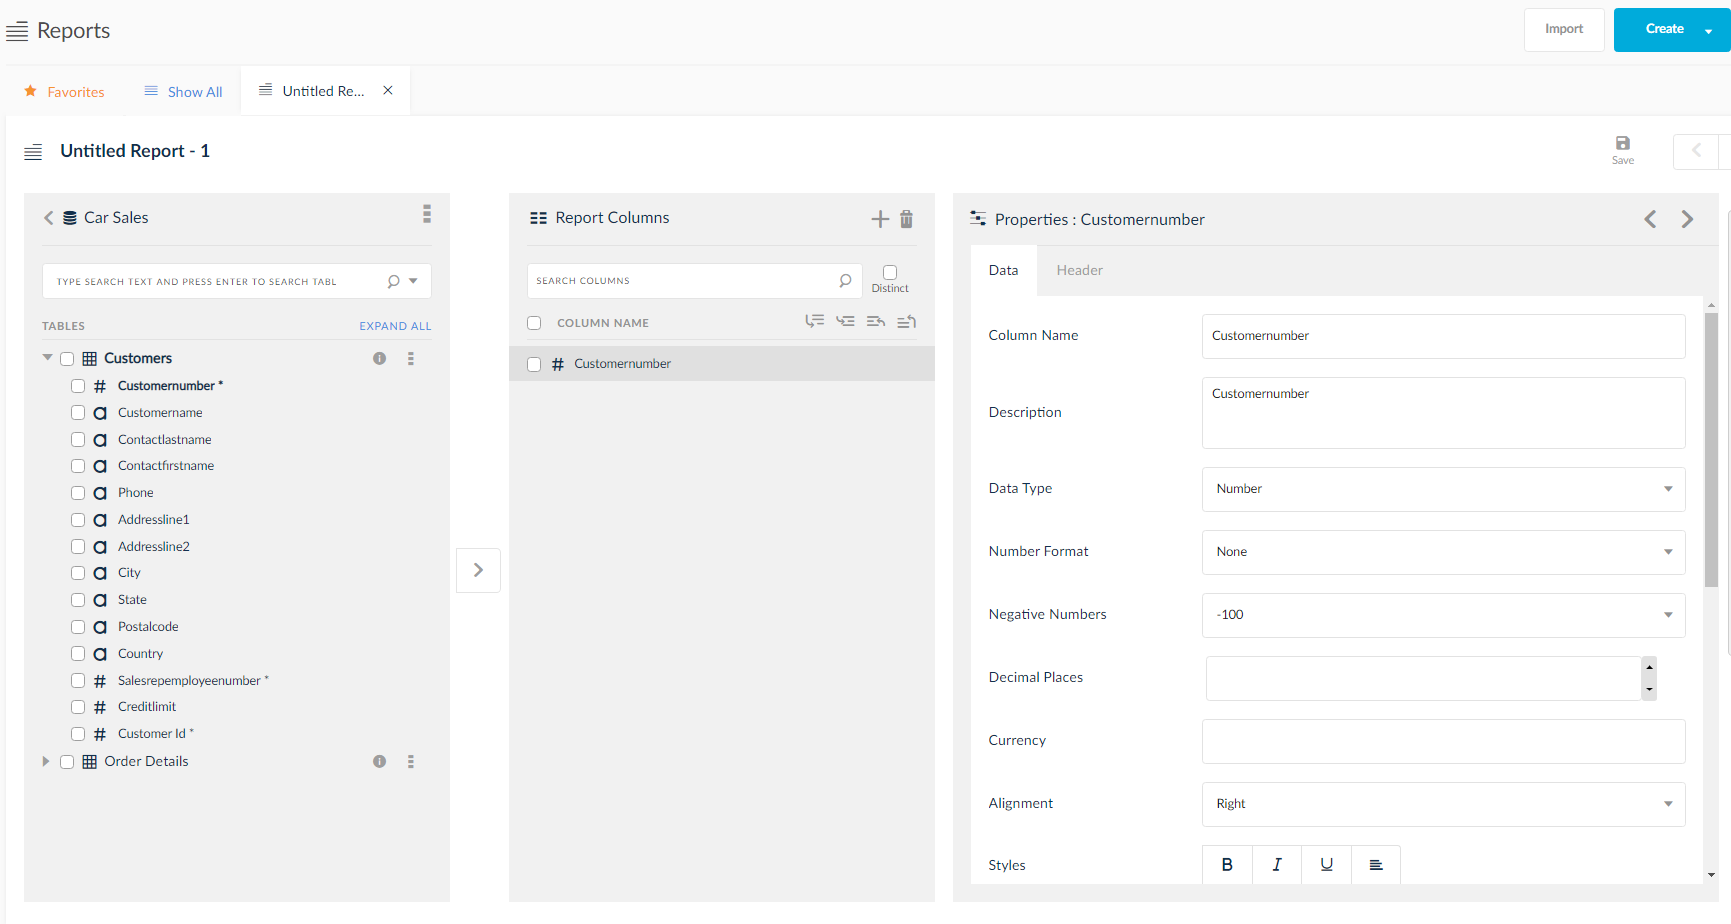
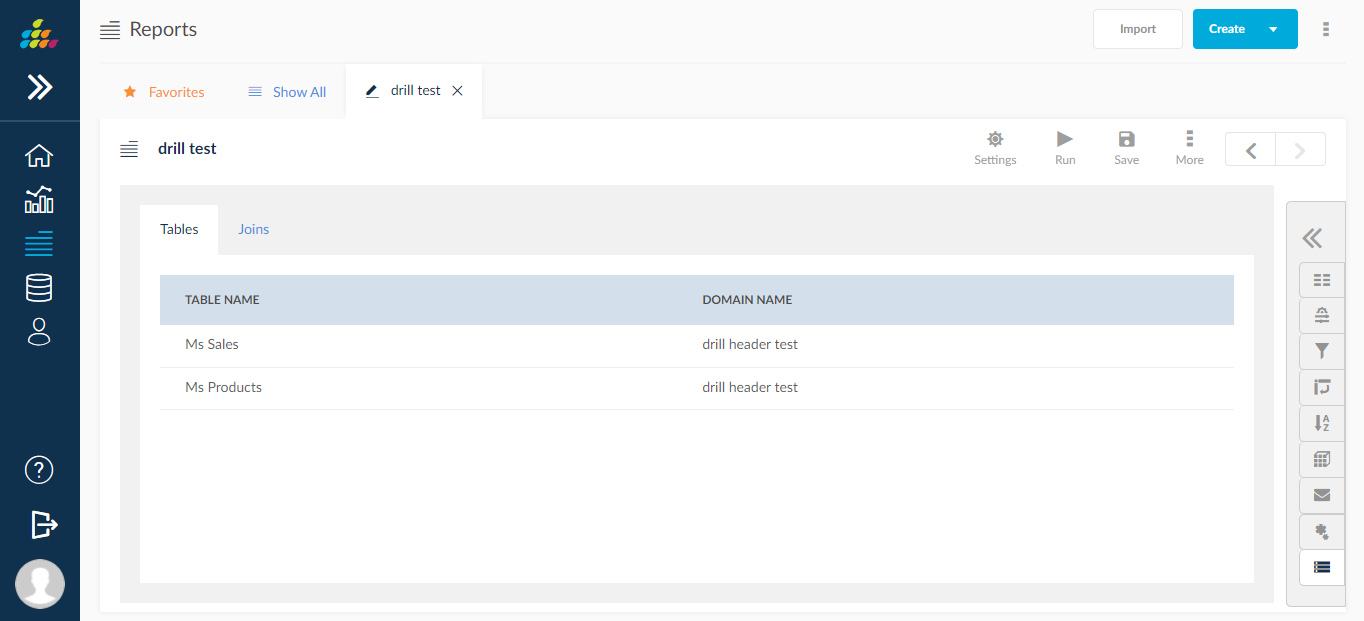
3. In the Configure Report screen, select the specific domain that hosts the desired data.
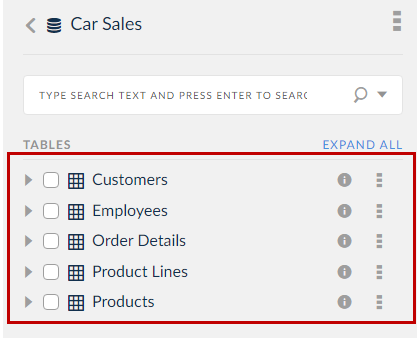
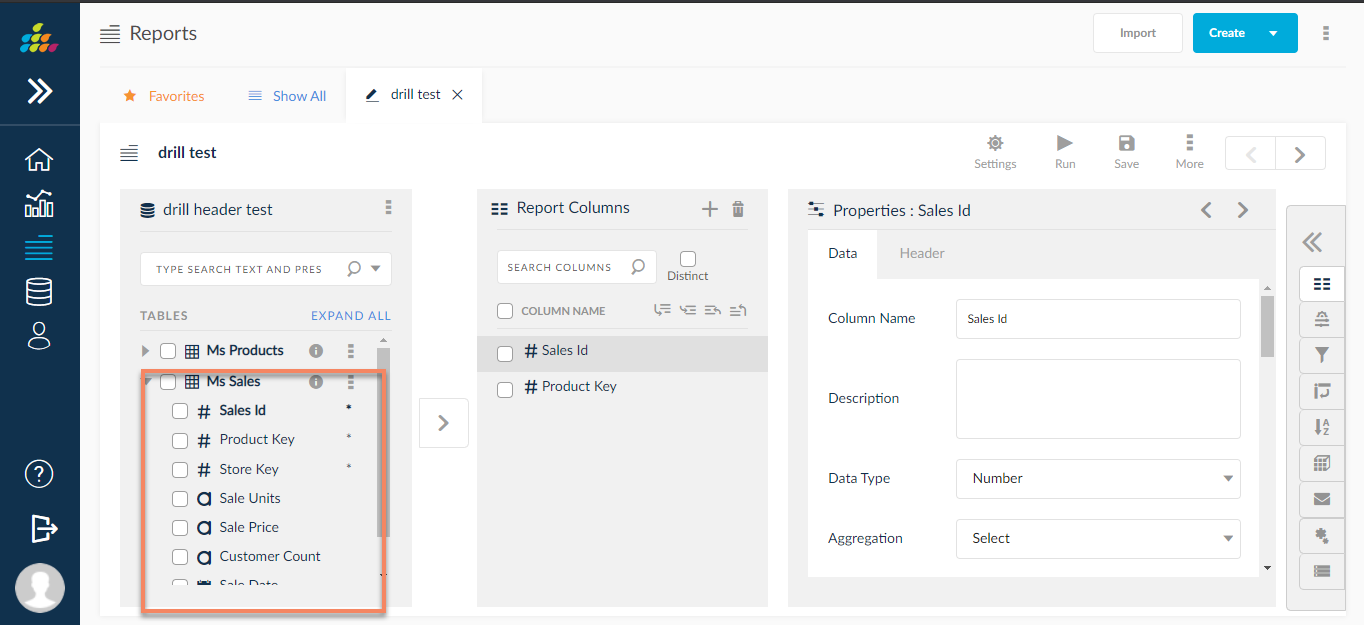
Domains List: Select the organization domain to pull portions of data to populate the Report. Once the domain has been selected, the configuration screen will be re-populated with the available tables that reside in that domain. Start the drag and drop operation of the desired columns into the report columns window.
- Tables Window: Displays tables containing data in the selected domain.
- Report Columns: Listing of selected columns being installed in the report.
- Column Properties: Customize the look and feel of each individual column by changing properties such as type formats, styles, alignment, color etc.
- Progress Icons: These icons show each portion of Creating & Editing Charts that can be customized. Complete a section and click the Next or Previous icon to move forward or backward through each section. The icon that is a darker shade than the other icons indicate the active edited section. To proceed to the next step in creating a report, continue reading.
Circular Join
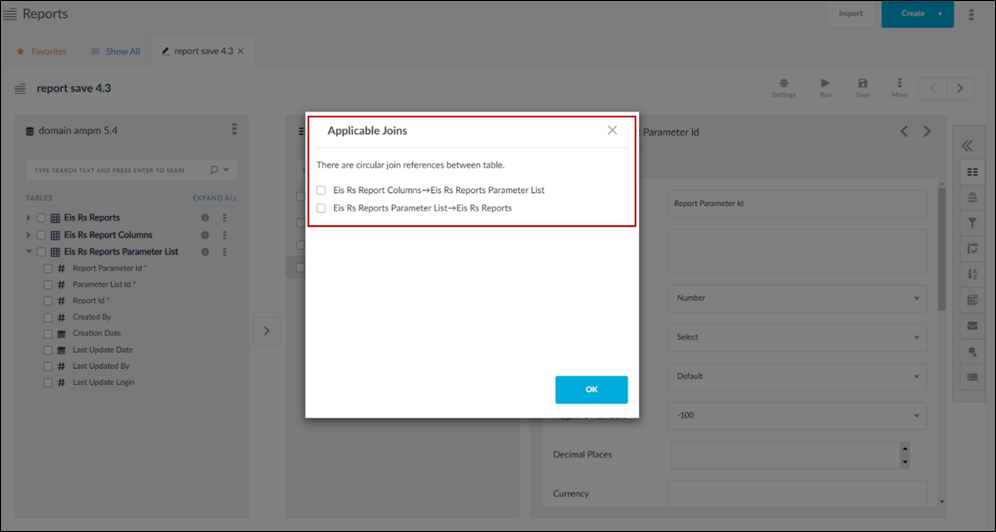
Circular join is a type of join that comes into picture when columns from more than 2 tables are used to create a report. An alert will be displayed when columns are dragged and a choice to choose between the available joins is displayed.
For illustrative purposes, three tables are used here. As observed in the below image, the third table (Order Details) is joined both ways with the first (Customers) and second table (Employees). Also, observe that the Customers table is in a one way join to the Employees table.
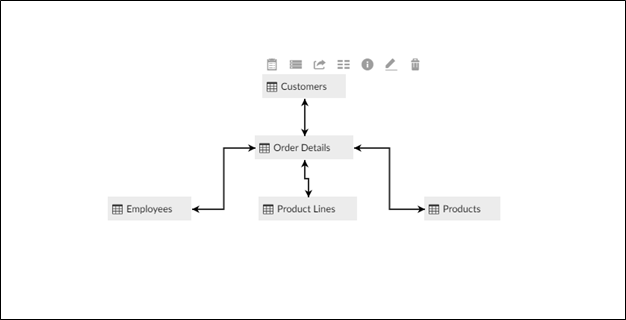
During the create report process, by dragging and dropping a column from a table, you will be able to view all the tables that are joined to the initial table. Tables that are not joined to the initial table will not be displayed.
The third table (Order Details) here forms a circular join resulting in the formation of unintended extra joins that will narrow down the input data in the final report output. To avoid this situation, you will be informed about the presence of a circular join and given a choice to choose the required table join to resolve the issue. Choose a table and click OK.
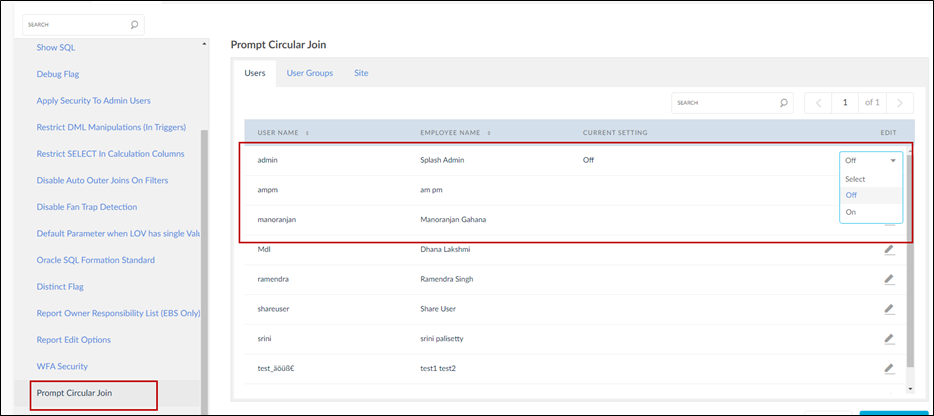
Switch off the circular join alert from the report settings and admin user settings page.
At the Report Level
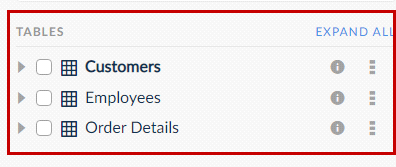
First driving table Should Be Expanded
After editing the report, always first table in the Data source screen among multiple tables should be expanded by default.
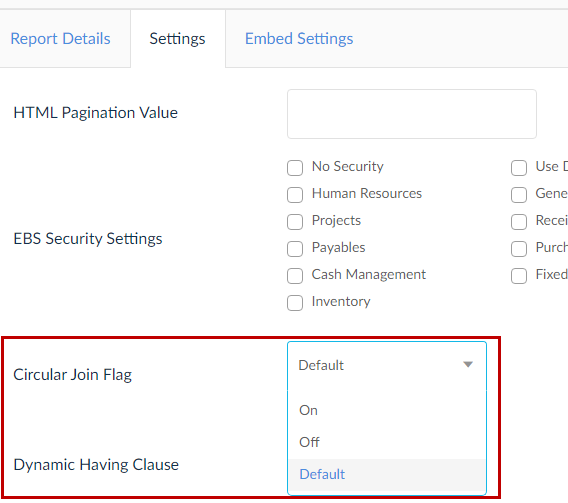
By default, the option selected at the report level is Off. The admin can turn it to On. By selecting Default the user is reflecting the option chosen at the Admin level.
Report Icons
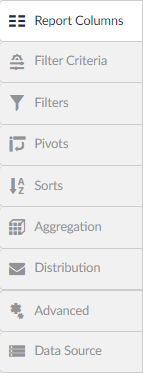
- Report Columns: To learn more on this topic, click here.
- Filters: To learn more on this topic, click here.
- Filters Criteria: To learn more on this topic, click here.
- Pivots: To learn more on this topic, click here.
- Sorts: To learn more on this topic, click here.
- Aggregation: To learn more on this topic, click here.
- Triggers: To learn more on this topic, click here.
- Distribution: To learn more on this topic, click here.
- Advanced: Contains Drilldown, Data Source, Template, Portals and Totals.