Report Totals
Totals feature can be used to perform aggregations on data for selected columns. Configuration executed in Totals can be applied in Excel, HTML, PDF outputs. Whereas in excel output totals can be applied by adding a sheet called Totals.
To create a total:
- Click Edit for the report.
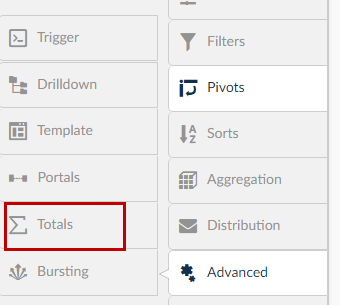
- Click Advanced to display a list of icons.
- Click the Totals.
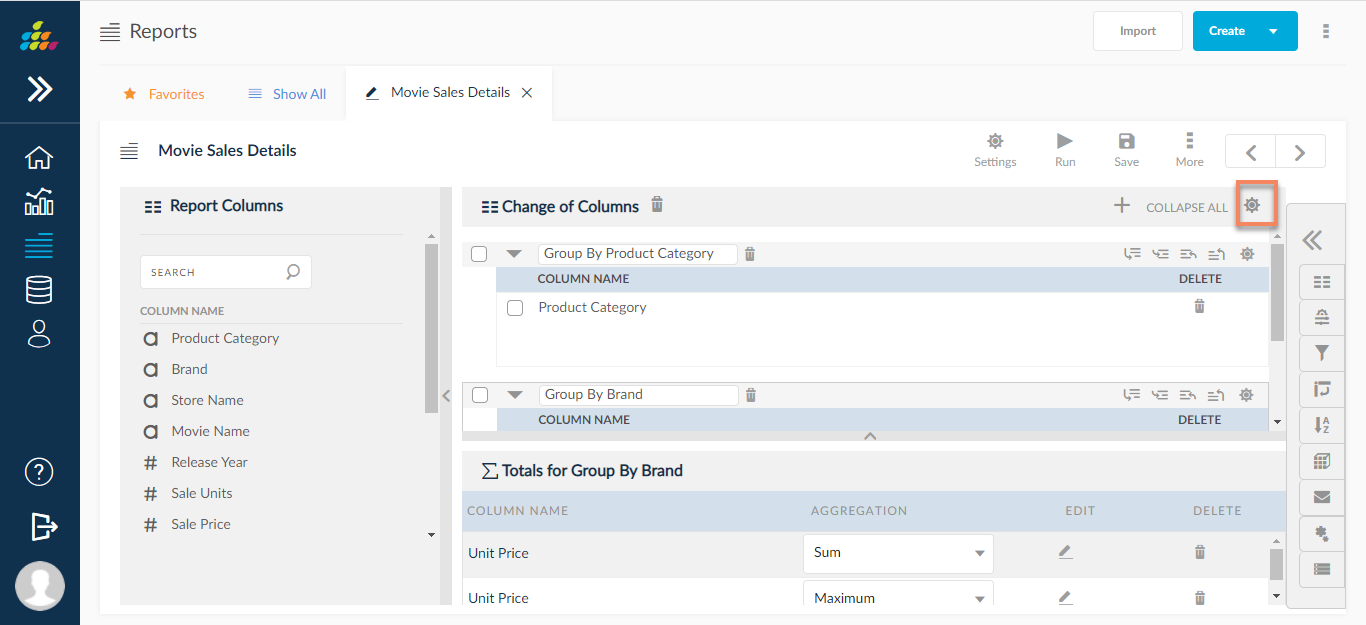
4. In the Change of Columns section of the window, drag and drop columns from the Report Columns window. The column selected in Change of columns field allows to select the column based on which data has to be grouped for aggregating the data. Here the user has two options:
- Click on setting icon present in change of columns panel.
- In Settings Tab Check the Repeat Data box to. Repeat the data in the grouping column for each row.
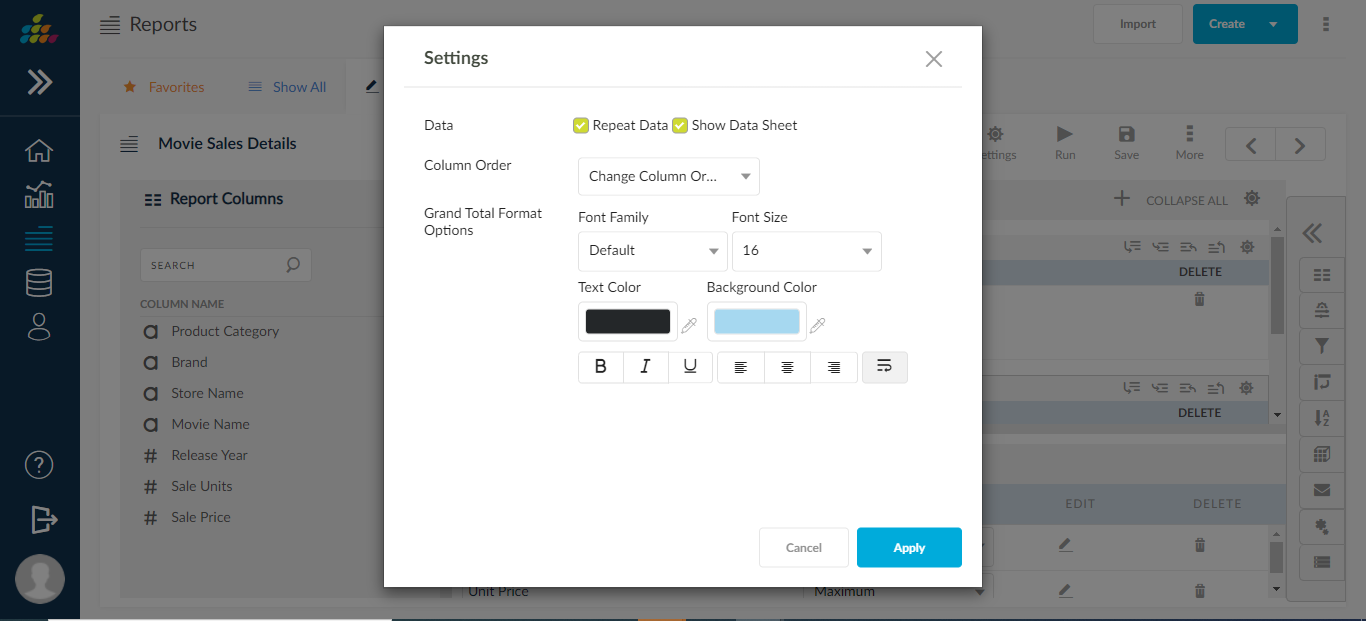
- Check Show Data Sheet to display the detailed data sheet along with the Totals sheet in the output.
- In Column Order drop down user have 2 options
Change Column Order: In outputs the column order will display according to change of columns
Report Column Order: In outputs the column order will display according to report columns
- Grand Total: Aggregations are applied on selected columns for each group (aggregate) in Change of Columns. Choose Grand Total to display the sum of all the aggregations of individual groups.
In the above screen grand total row can be customized with user preferred font size, font, text color, background color, bold etc...
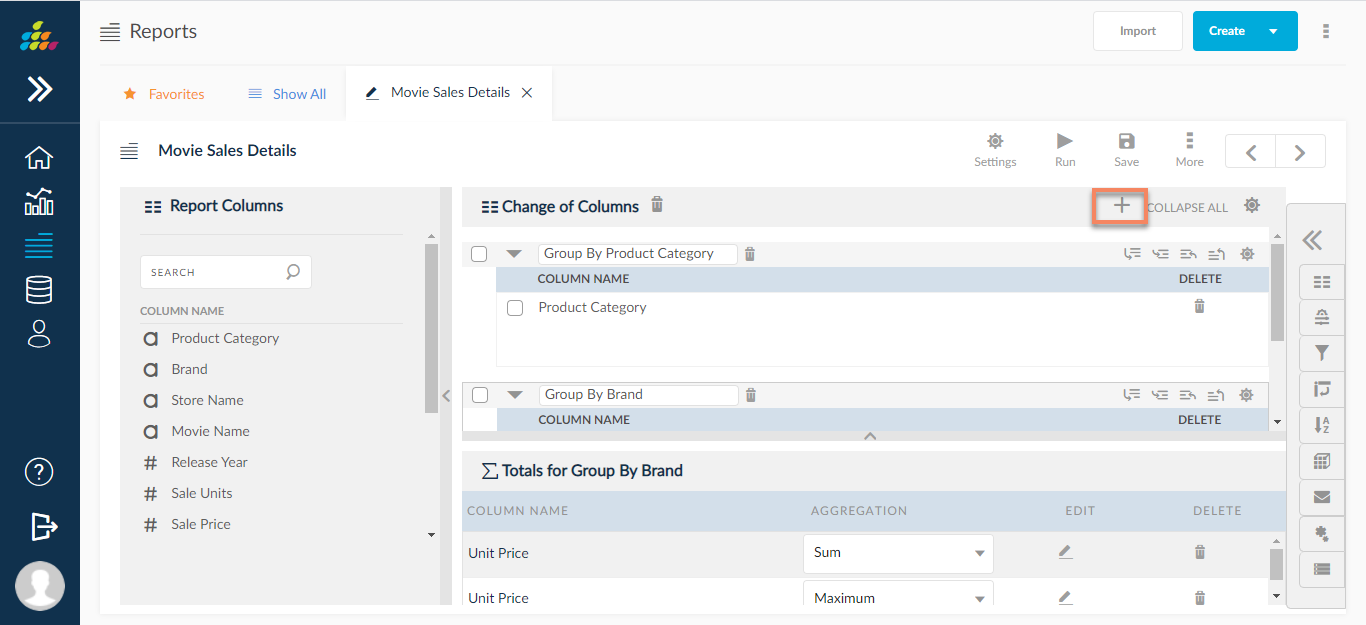
User can create multiple group by clicking on the + icon present in change of columns header.
On clicking on + icon a drop down is displayed in that drop down.
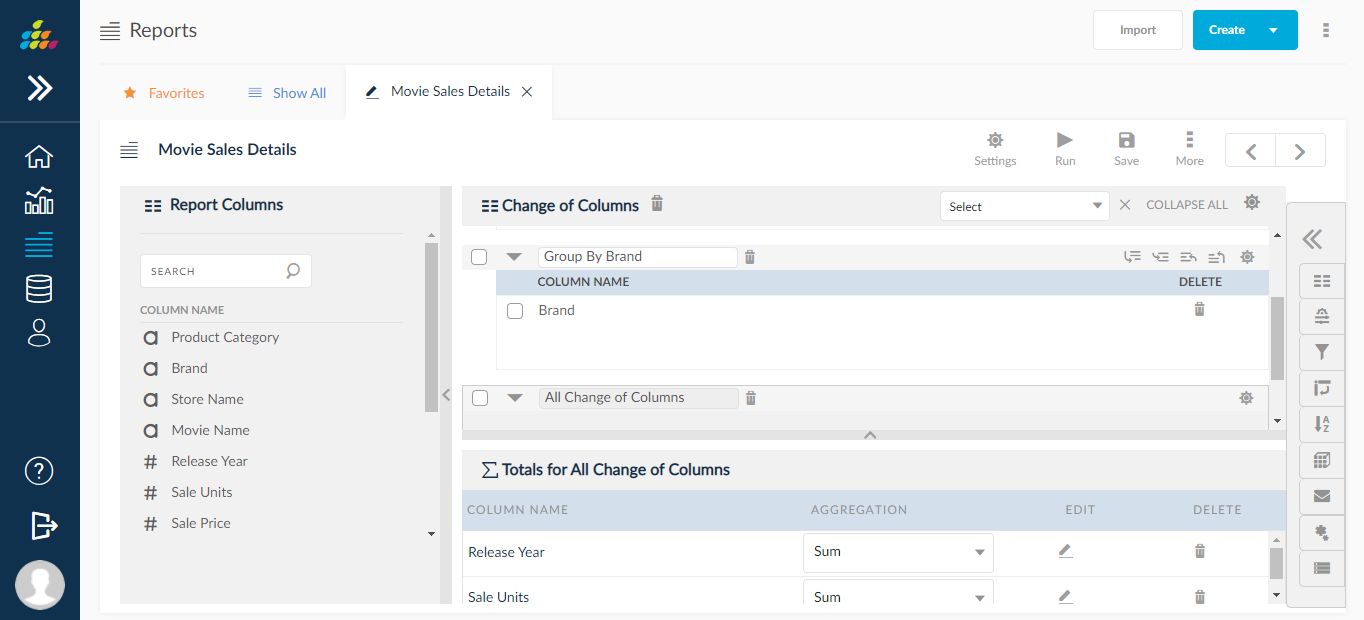
Add New Group: Click on add new Group the new group will display below the already existed group.
All Change of Columns: When values for all change of columns in the groups changes corresponding aggregates are formed.
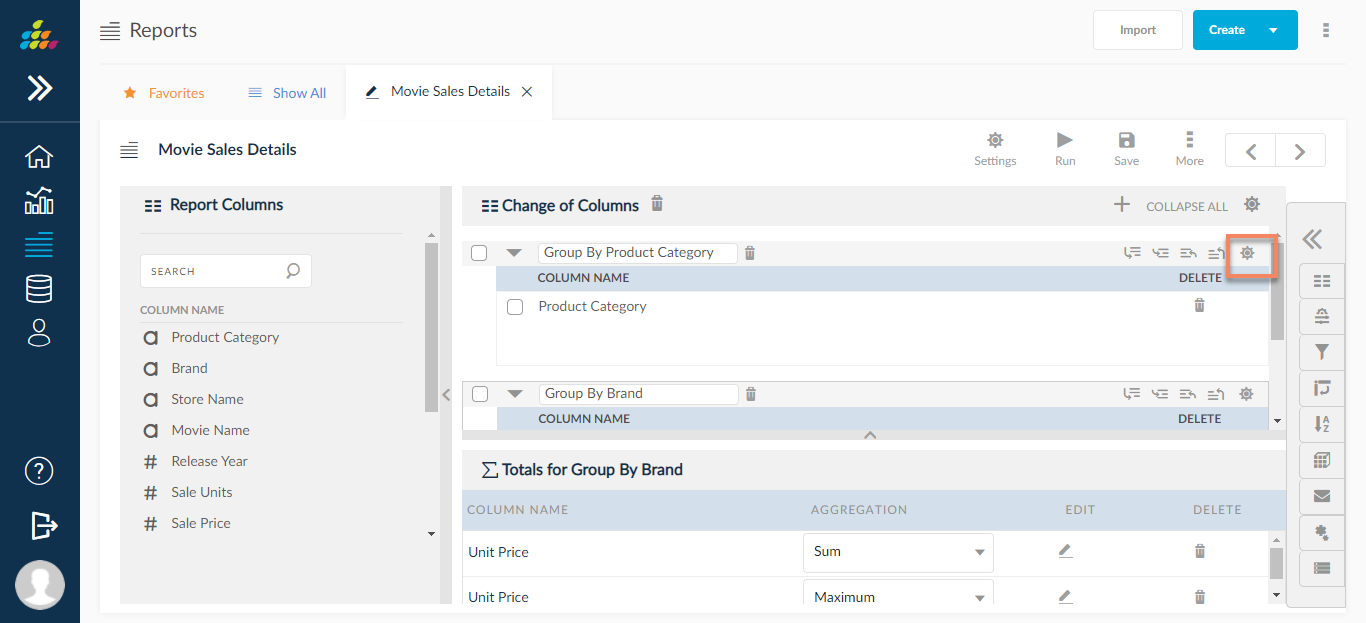
For Each Group User can customize some setting and styles for sub totals labels On clicking on setting icon as shown in below screen shot.
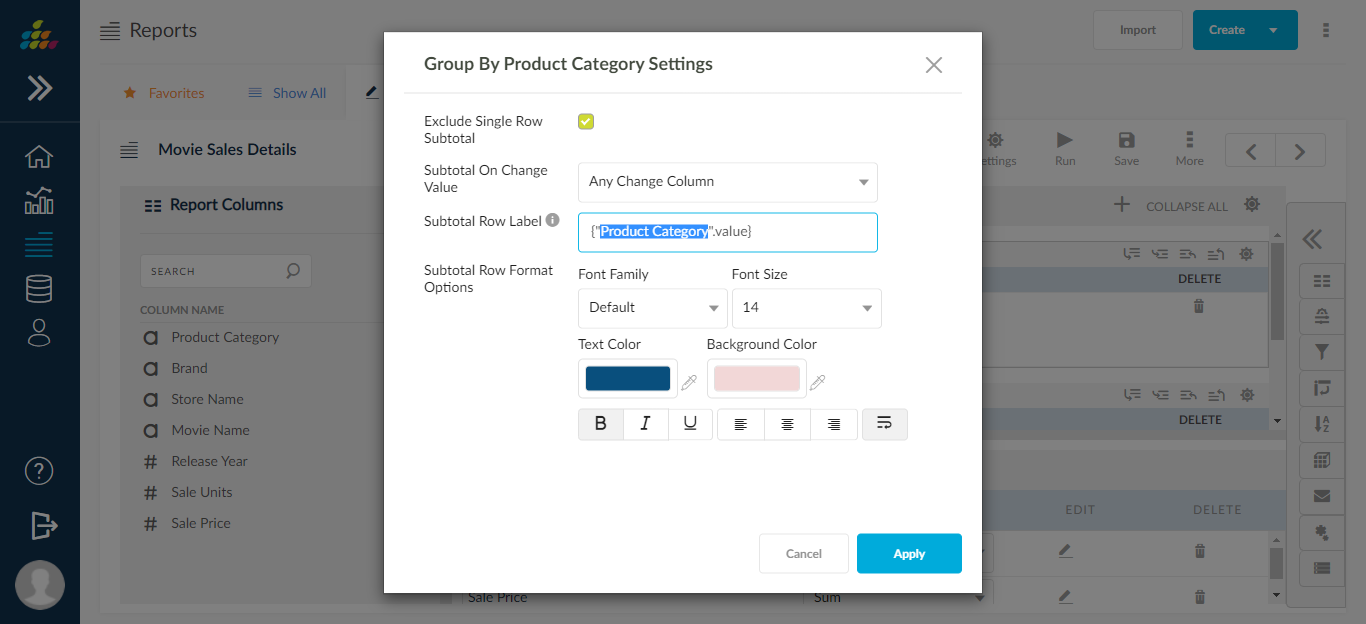
Exclude Single Row Subtotal: If it is checked subtotals will not generate for single row totals.
Subtotal On Change Value: In this we have a drop down if it user can change according their preference.
Any Change Column: Subtotal will generate for even single column change.
All Change Column: Subtotal will generate only if all column in group will change.
Subtotal Row Label: User can configure the value of the change column label in following syntax format.
{“name of the change column”.value} as a placeholder to output the value of the change column.
Ex: {“Product Category”.value}
In the below screen subtotal row can be customized with user preferred font size, font, text color ,background color, bold etc.
- In the Totals window, drag and drop columns from the Report Columns window. There is an option present here:
- Multiple aggression can be achieved on same column in Totals window.
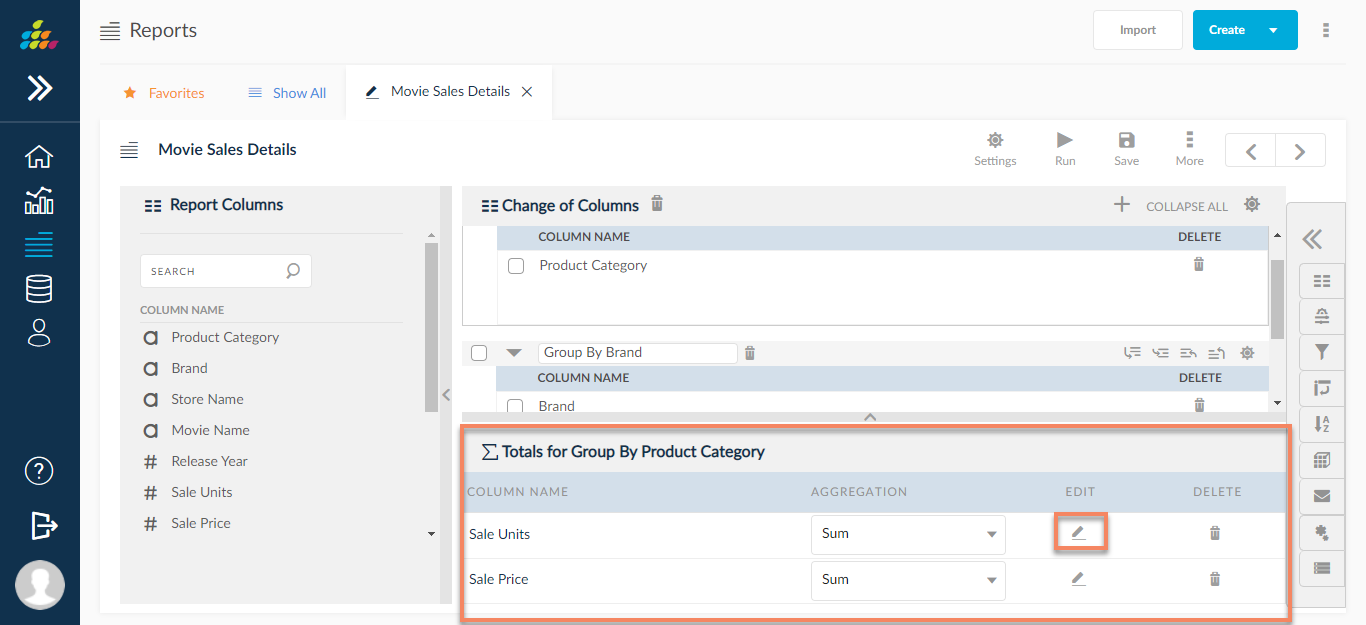
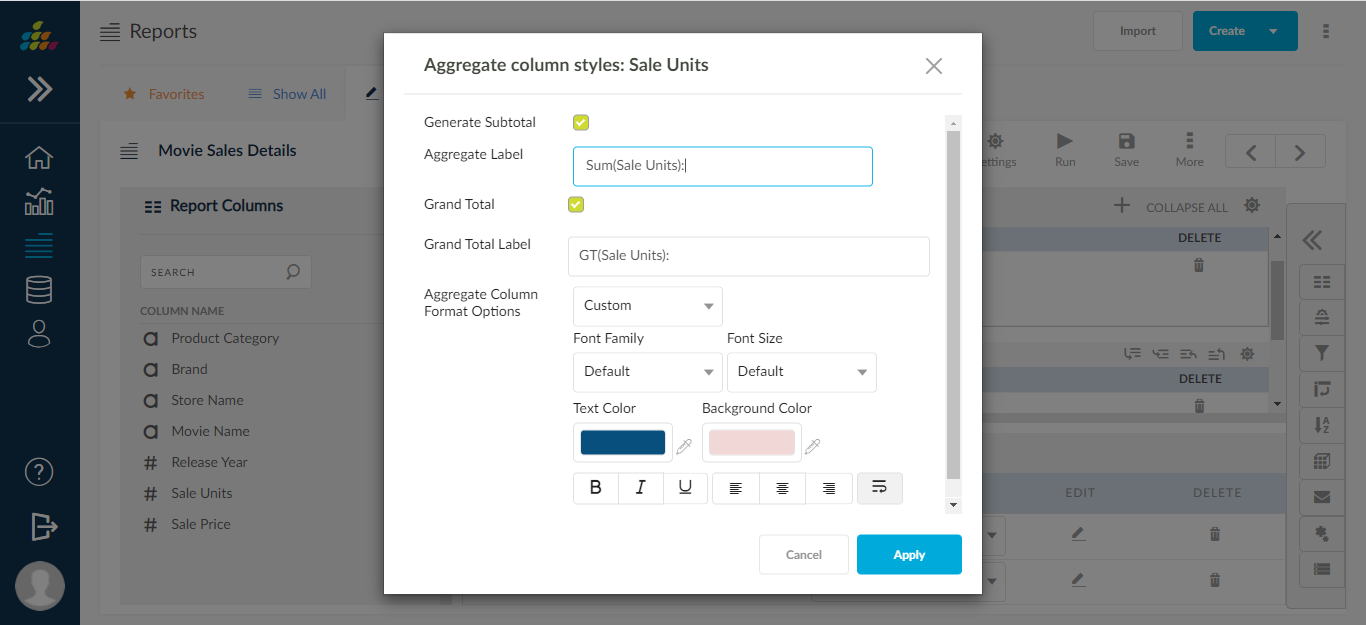
7. In edit aggression screen we can customize the grand total label and aggregate total label and user can apply styles like font, color etc. in the below pop up.
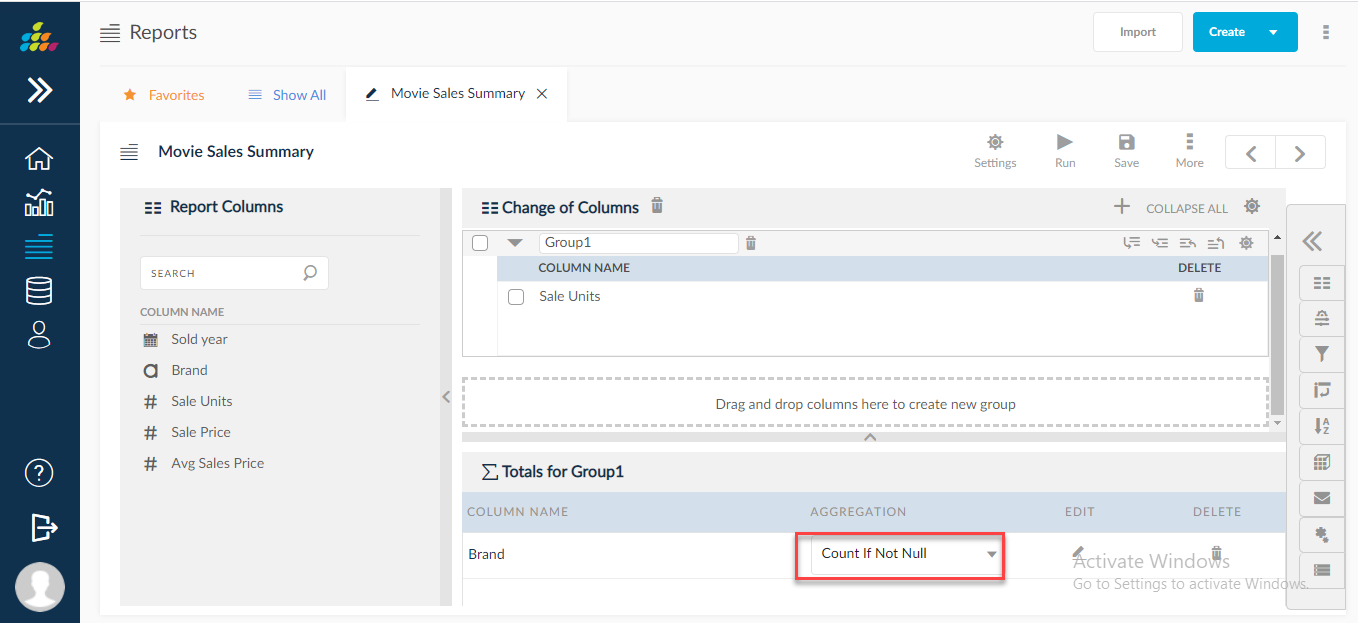
NOTE: You can directly add the columns to the Totals panel without adding any entry to the Change of Columns panel. The count of the columns added to the Totals panel will be displayed in the report output. This eliminates the dependence on the column placed in the Change of Column panel for Totals output.
Add new aggregation function COUNTIFNOTNULL in totals