Domain Table Details
Tables
Tables can be selected to a domain by dragging and dropping objects. When an object is dragged and dropped, a line of records will be displayed under the tables. When a table row is selected, the below tabs will be displayed.
Table Sorts
Tables can be sorted by selecting them and using the ![]() icons.
icons.
Rearranging Tables with Drag and Drop
In Domains, to rearrange the order of domain tables and table columns during the process of creating or editing a domain, use the drag and drop option instead of using up and down arrow keys.
Details Tab
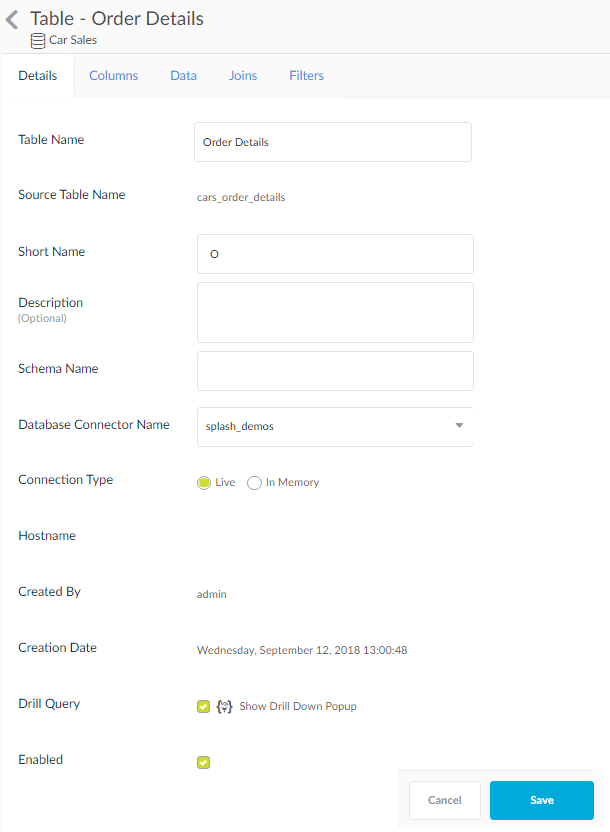
Table information will be displayed:
- Table Name: Default Source table name is populated.
- Source Table: This is a read only field.
- Short Name: It displays the alias name of the table name.
- Description: It is a sticky note in which the description of the domain is written.
- Schema Name: Displays the name of the schema of the database.
- Database Connector Name: Choose the connection name.
- Connection Type: The connection type can be Live or In memory. When the connection type is selected as In memory, options like Load Now and Schedule will be displayed.
- Host Name: Displays the ip address of the host.
- Created By: The table owner name is displayed.
- Creation Date: Table creation date is displayed.
- Drill Query: Will enable the drill query. Click the icon beside the check box to view the droll down information popup.
- Enabled: Check this to make it visible and editable.
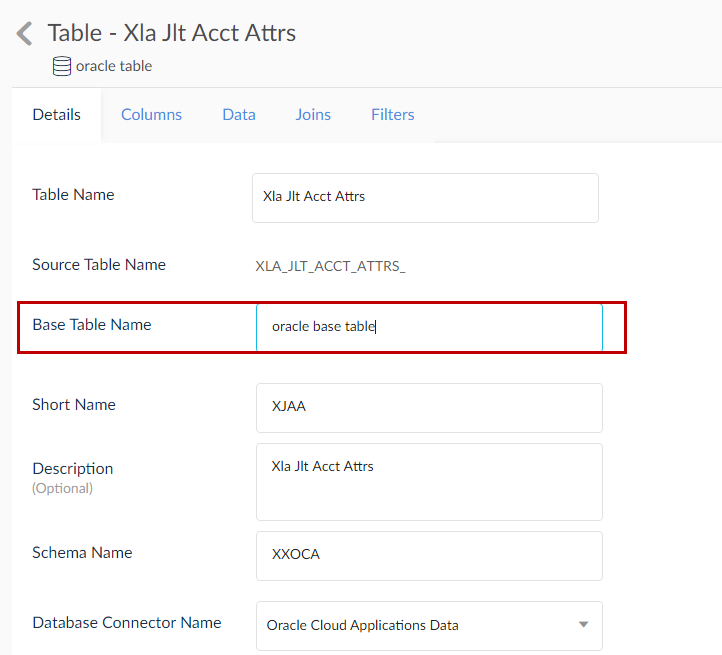
NOTE: In case of Oracle Cloud domain, there will be another option by the name Base Table name. This name will be visible when that particular table is used in report creation.
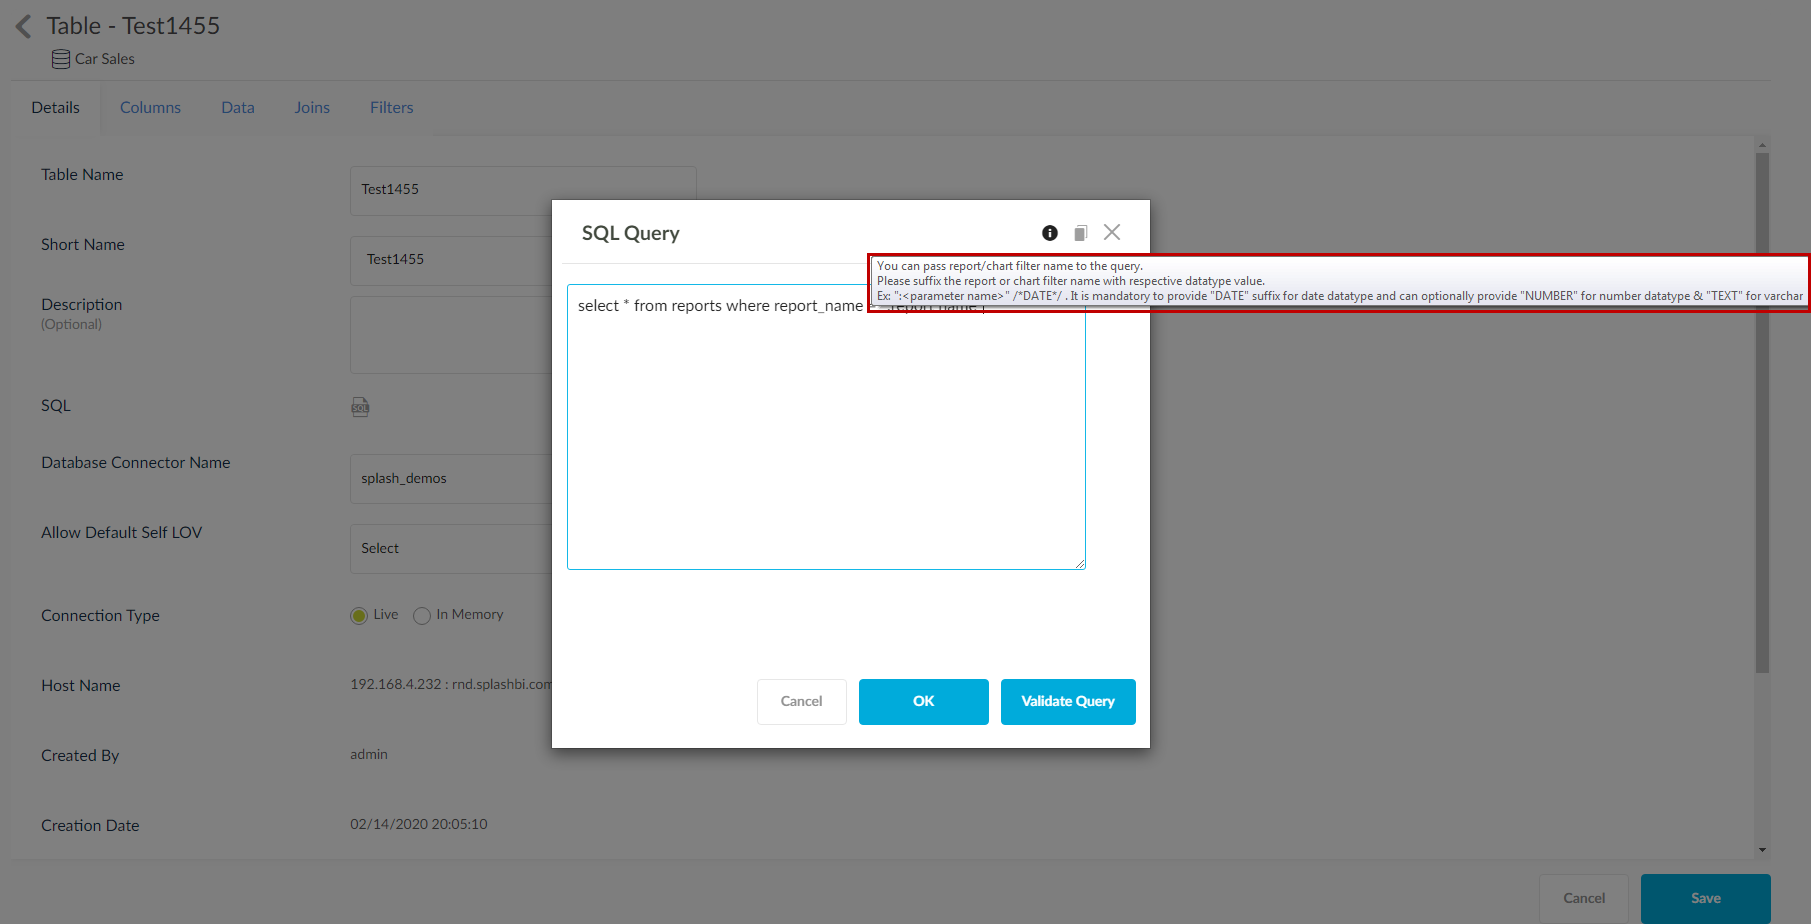
For SQL tables, you can view the SQL query in the Details tab. You can pass the dependent report/chart filter name to the query. Please suffix the report or chart filter name with the respective data type value.
Ex: “:DateParam” /*DATE*/ . It is mandatory to provide a “DATE” suffix for the date data type and can optionally provide “NUMBER” for number data type & “TEXT” for varchar.
These options are can be viewed in the SQL based tables in the domain section.
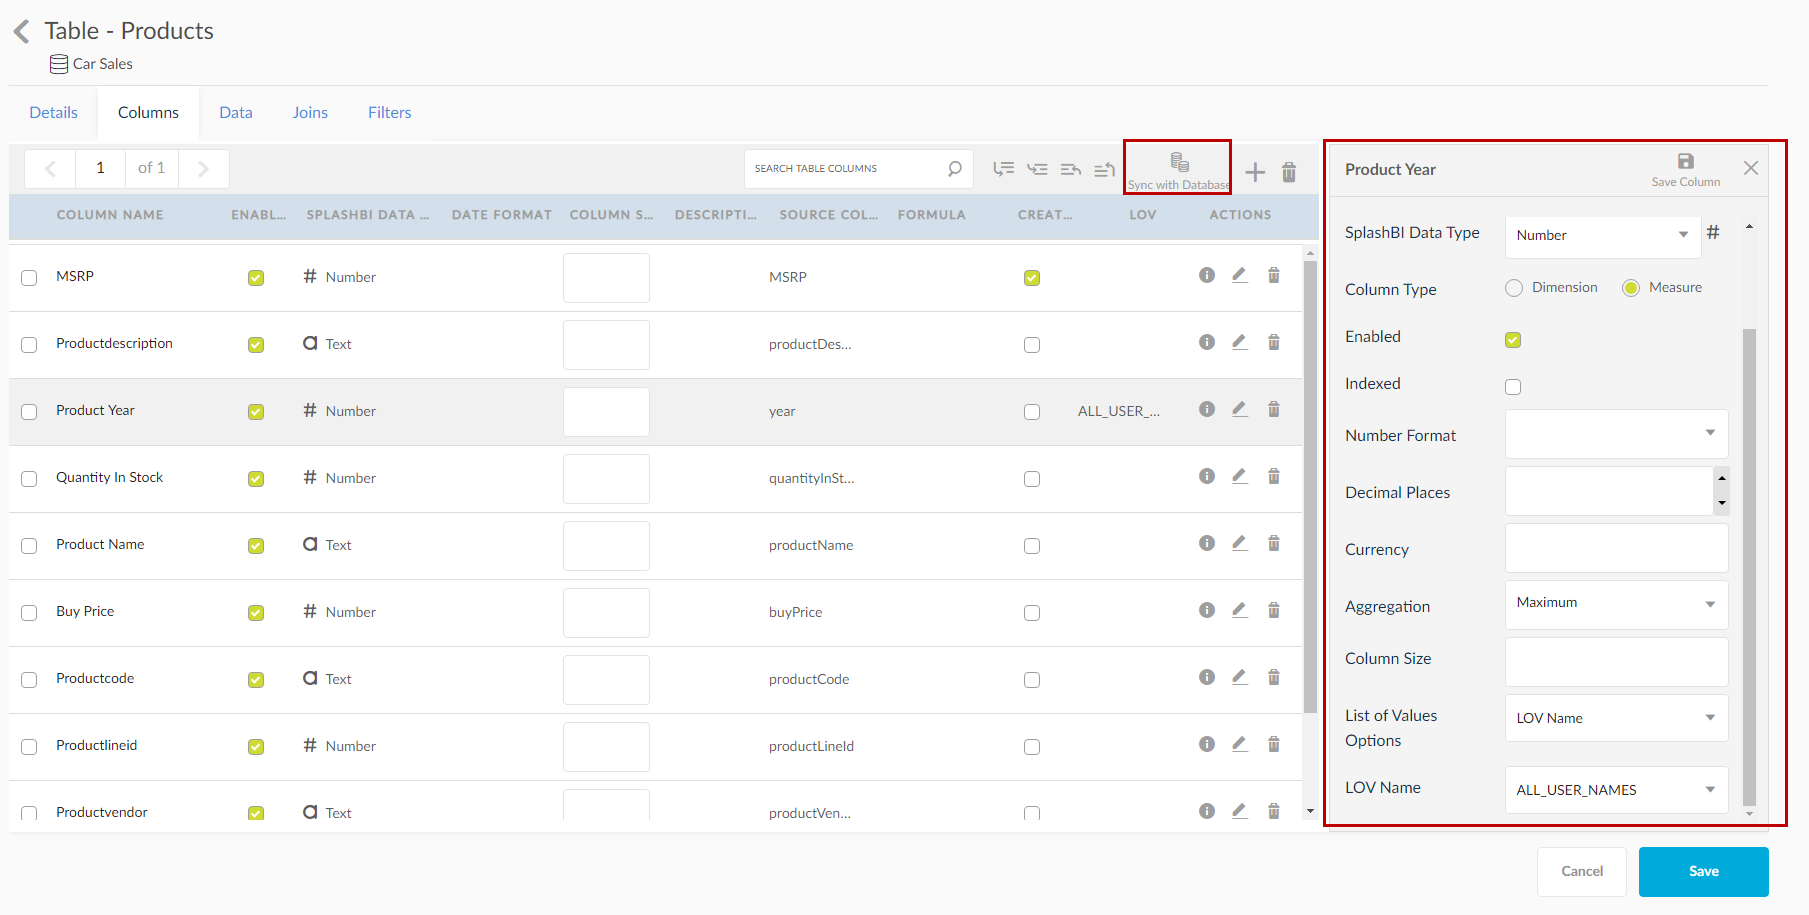
Columns Tab
The columns tab will show the selected columns.
The columns tab will show the available columns in the table.
- Click the
 icon to update that column details and click the
  icon to save the edit. Below are the details that can be edited at a column level.
 - Column Name: This field can be modified to change the name of the column.
- Description: The description column displays the column description. By default, the column name will be displayed as the description while loading columns. It can be modified to give a description desired.
- Splash Data Type: Override the data type of the column. The drop down contains Text, Number and Date icons. Data types can be selected for that column name for overriding the data type. This change is only applicable for the SplashBI metadata and does not over write the column definition in the database.
- Column Type: Specify whether the column will be displayed as a Dimension or Measure at the time of Chart Creation. By default, all the number columns are categorized as dimensions.
- Enabled: Check this box to enable the column for selection into reports/charts. When this checkbox is unselected, edit will not be displayed in the report/chart creation screens. This does not affect the data in the database.
- Indexed: Check this to create index.
- Aggregation: Select from the drop down the aggregation that applies to the column selected. This aggregation will be reflected in the reports creation and chart creation when that particular column is selected.
- List of Value Options: Select from the options the type of LOV’s. More about this is discussed at List of Values.
- Sync with Database: Click the
 icon to sync the changes made in database to the table metadata within SplashBI. This will consider any changes made to the columns definition within the database.
 - Functions are loading by connected source database for domains in Calculation Columns.
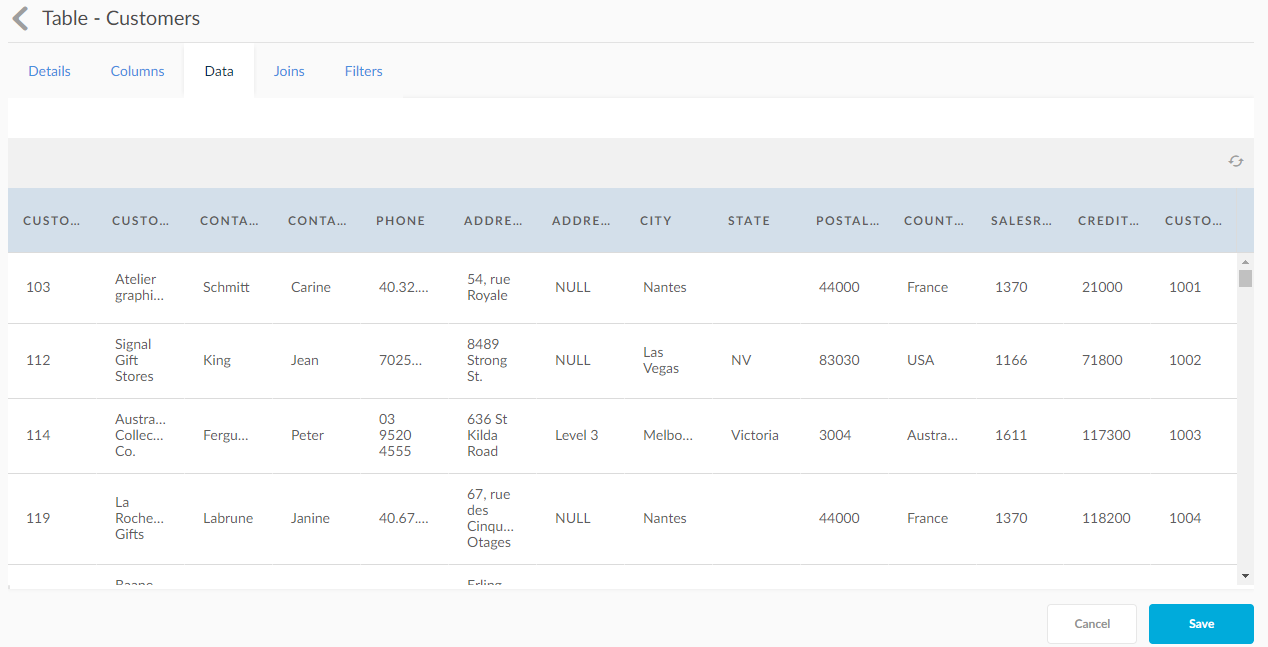
The data tab shows the data available in the table This is a read only view and does not allow changes to the data from this page. If any changes need to be done, they have to made from the database. Click on ![]() icon to refresh the data. If any new records are added in the database, the refresh icon will load the new data in the data tab.
icon to refresh the data. If any new records are added in the database, the refresh icon will load the new data in the data tab.
Joins Tab
Joins tab allows you to join the table with other tables in the domain. Using this option, you can pre-define the joins in the domain level so that the end you can select columns from any of the joined tables at the time of report creation.
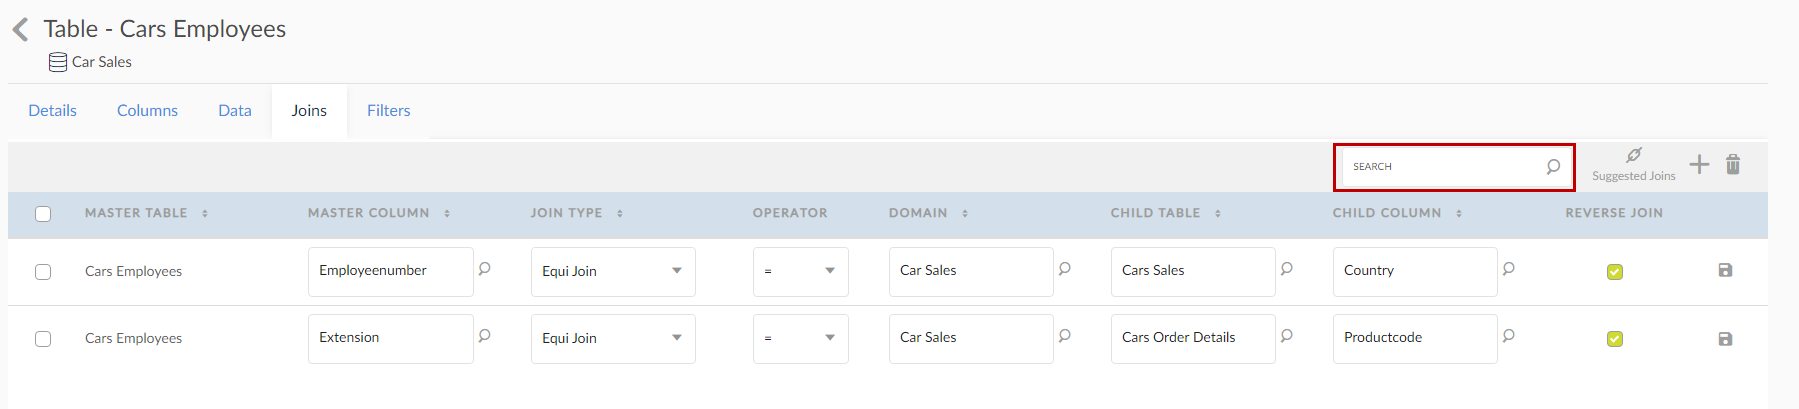
- Click the
 icon for the system to display a list of unused joins as suggested joins. Select the check box and click on the load joins icon to load the joins for the table.
 - Click the
 icon to add the join manually. Select the table column using which you would like to create a new join. Select the child table name and child column name from the Search field which you would like to join to the selected table.
Joins Explained
These are the types of joins that can be created in SplashBI
- Self-Join: This option is used to join a table to it.
- Equi Join: This option is used to create a condition using the = operator. Equi Join returns only the rows that have equivalent values for the specified columns.
- Non-Equi Join: Non-Equi Join is used to create a condition with <> (unequal) operator. This Join is used to match rows between different tables.
- Cross Join: This join is used to return a Cartesian product of rows from tables. This join will produce rows which combine each row from first table with each row from second row.
- Left Outer Join: The left outer join preserves the unmatched rows from the master table joining them with the null values in the child table.
- Right Outer Join: The right outer join preserves the unmatched rows from the child table joining them with the null values in the master table.
- Full Outer Join: This join is returns all the rows in both the tables when there is a match in either the child or master tables.
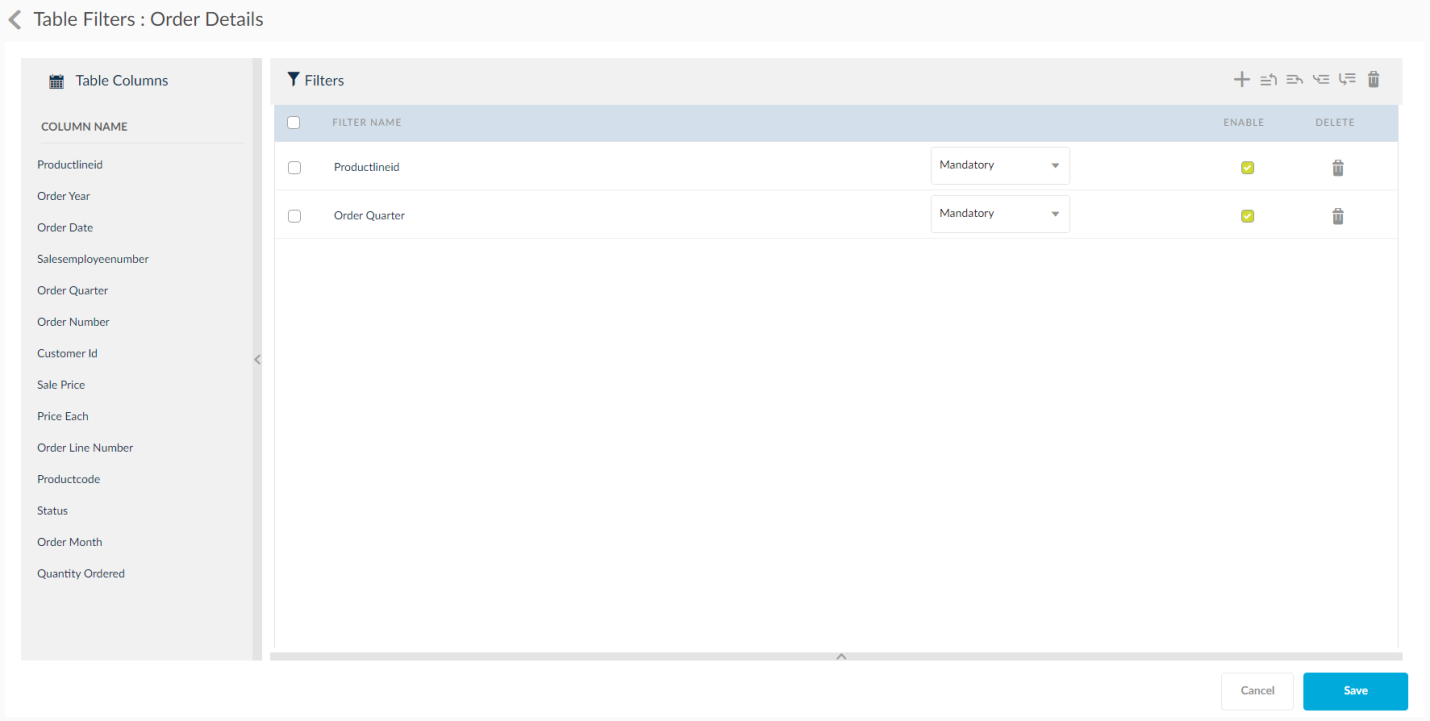
Filters Tab
This section allows you to create table level filters on specific table columns. The table created on this tab will be applied for all the reports created using the selected table.
Start by dragging & dropping the table columns you wish to enable a filter by clicking the ![]() icon.
icon.
As columns are added to the filter window, advanced options for that filter will be available.
- Click the Add Row icon to add more filter conditions. Filter logic with AND condition is displayed by default. You may change this to OR depending on the requirement.
- Check the Enable to make the filter active.
- Click the
 move icons to move the filters position.
Operator Meanings
- ! =: Not Equal To
- <: Less Than
- <=: Less Than Equal To
- <>: Not equal to (Oracle)
- =: Equal To
- >: Greater Than
- >=: Greater Than Equal To
- Between: The value should be between the Item and Values fields.
- Ends With: The Value should end with the specified value.
- In: Includes the specified number data types in the output.
- Like: Includes the specified string data types in the output.
- Not Like: Excludes the specified string data types in the output.
- Start With: Included the values that start with the specified.
- Not In: Excludes the specified number data types in the output.
- Is Null: Included the null values.
- Is Not Null: Excludes the null values.