Report Filter Criteria
In the Report Filters Criteria screen, build filters based on selected Columns. The Report Columns chosen in the previous menu will be visible in the Report Filters screen.
- Drag & drop the report column enables a filter. As the user adds more columns to the filter window, advanced options for that filter are displayed.
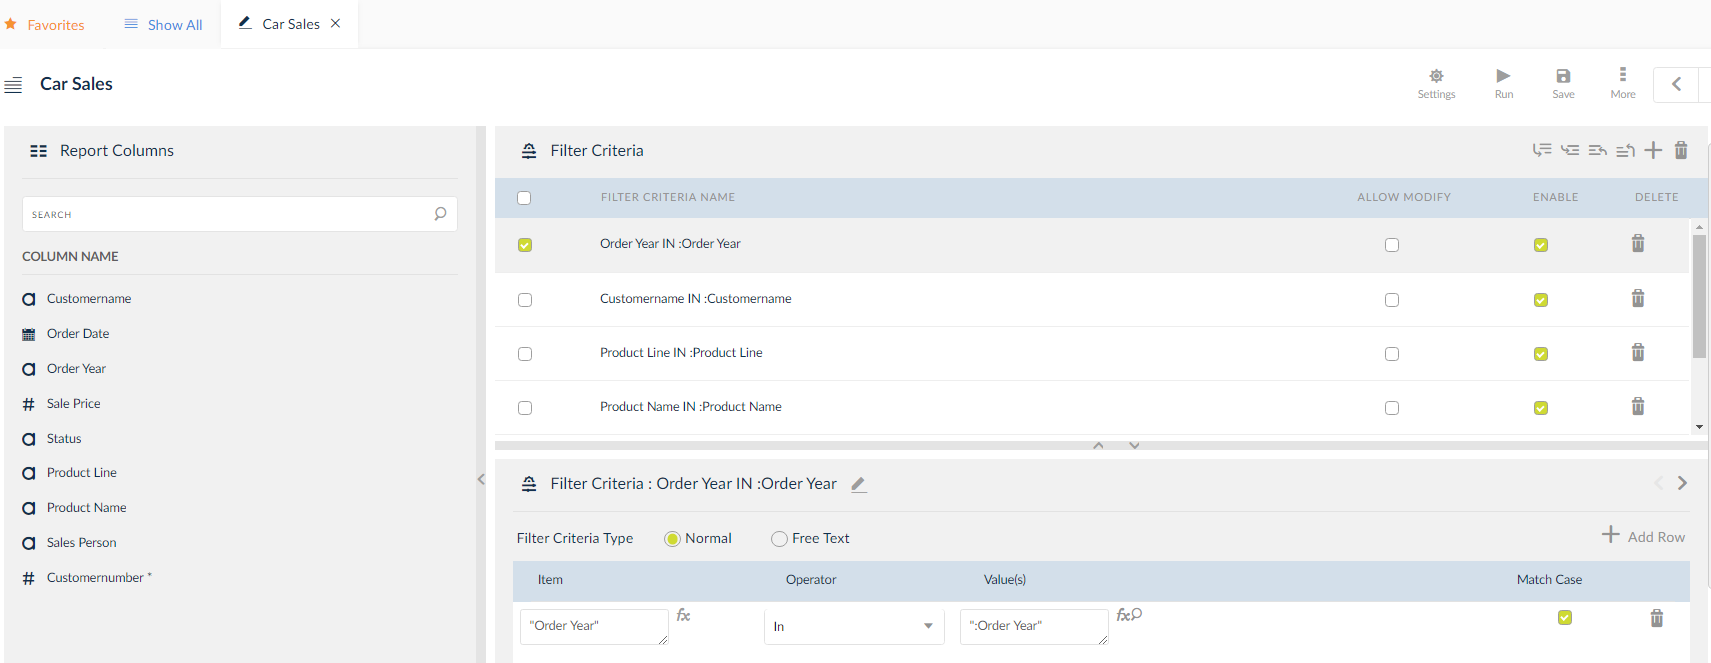
2. In the Filter Properties window, create filters utilizing specific functions and operators.
Types of Filters
Normal
By default, the filter type is set to normal. Click the ![]() icon to modify the entries in the Item and Value(s) column. To enter a formula, click the
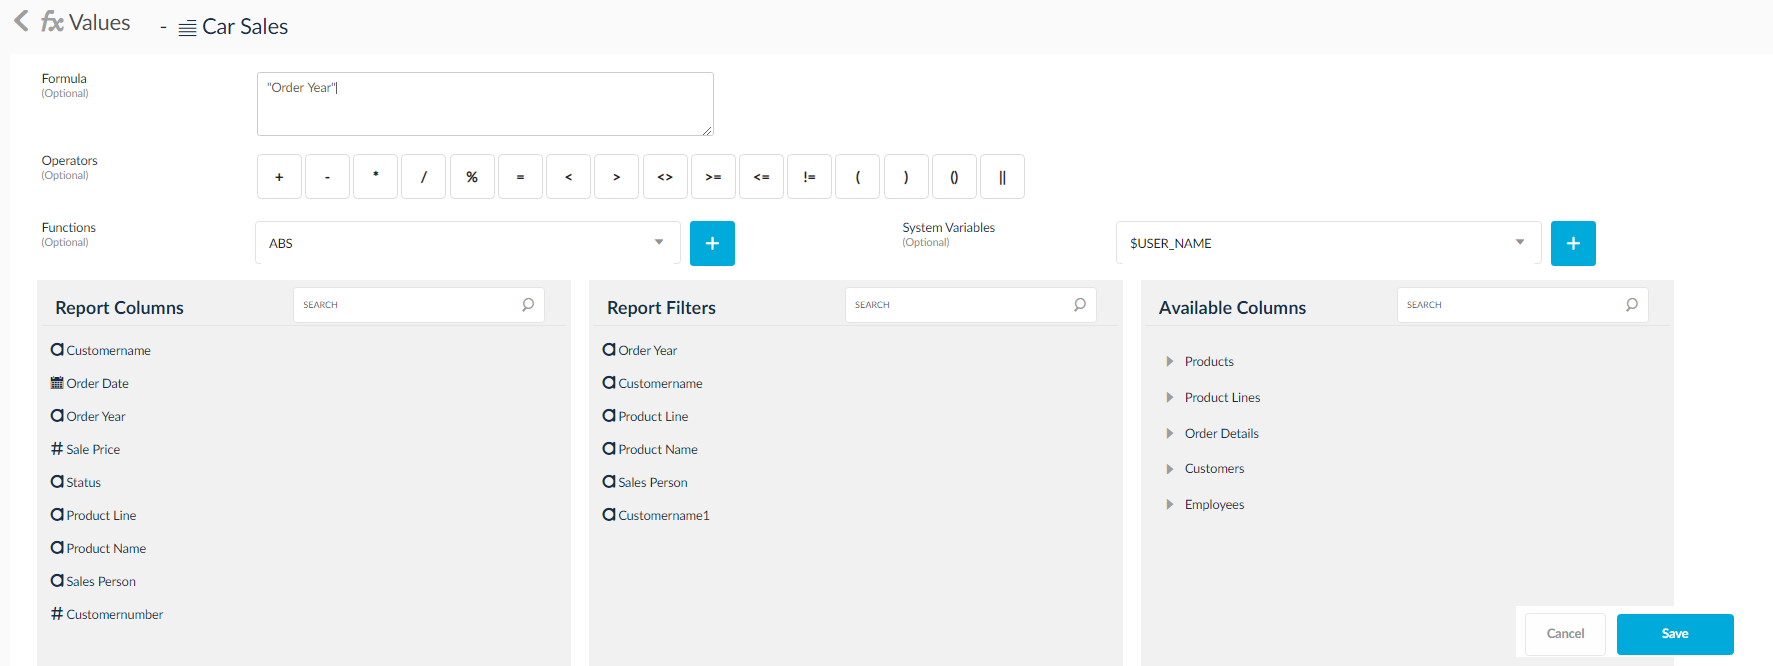
icon to modify the entries in the Item and Value(s) column. To enter a formula, click the ![]() icon and drag and drop Report Columns, Report Parameters or Available Columns. Click the
icon and drag and drop Report Columns, Report Parameters or Available Columns. Click the ![]() icon to choose values for Value(s).
icon to choose values for Value(s).
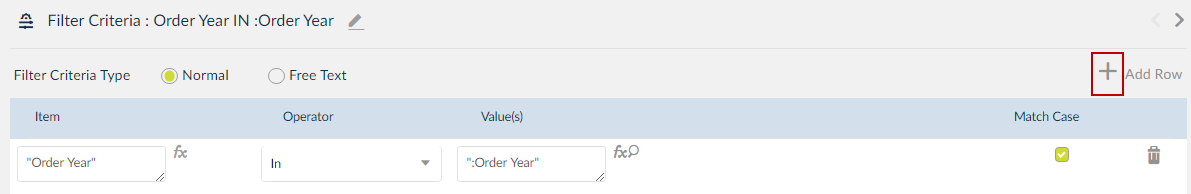
NOTE: Additional text box is enabled when the operator is chosen as Between. Click the Add Row icon to add another filter condition. Filter logic with AND condition is displayed by default.
Free Text
Add conditions in the text box provided. Click the ![]() icon to enter formula by dragging and dropping Report Columns, Report Parameters or Available Columns.
icon to enter formula by dragging and dropping Report Columns, Report Parameters or Available Columns.
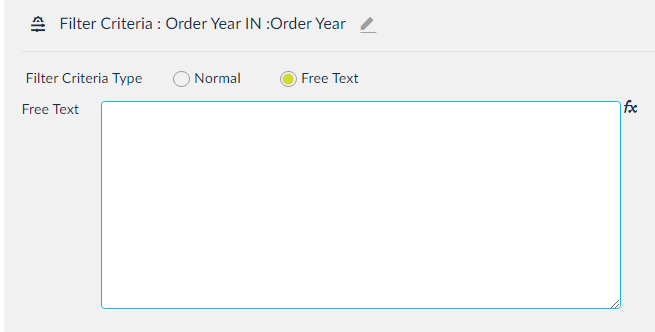
When you use free text to create a filter and do not select any configured filter during chart preview then the chart takes Null as the input and produces no output.
Navigation: Edit Report → Edit Filter → Free Text.
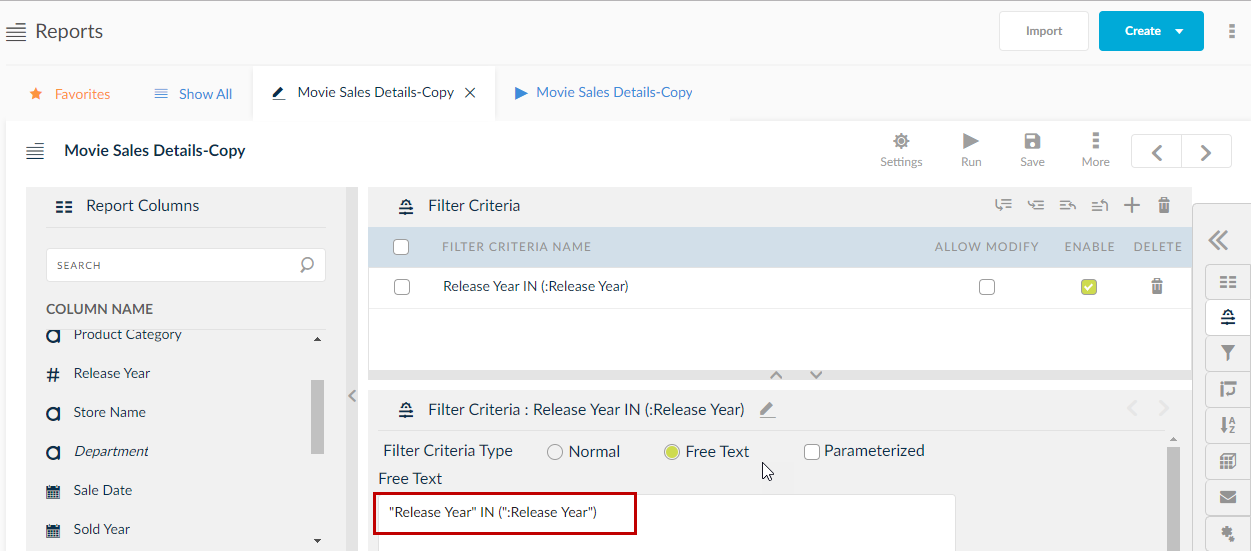
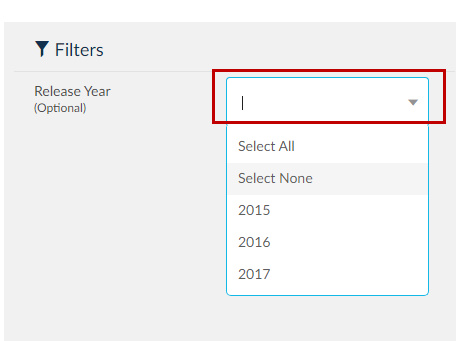
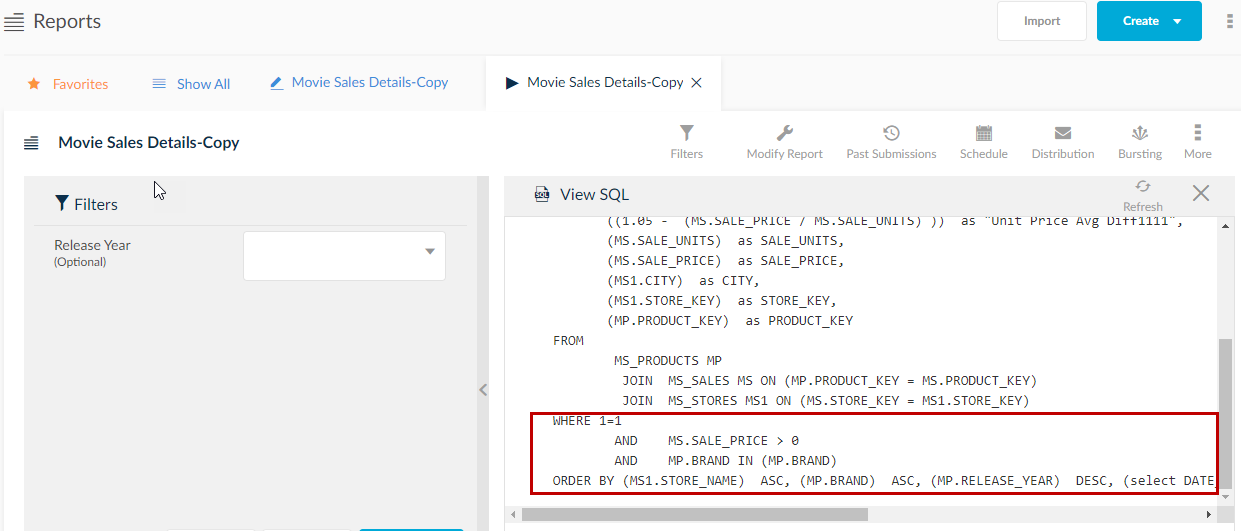
As observed in the below image, none of the filter values are selected.
The SQL query for the following will be as follows:
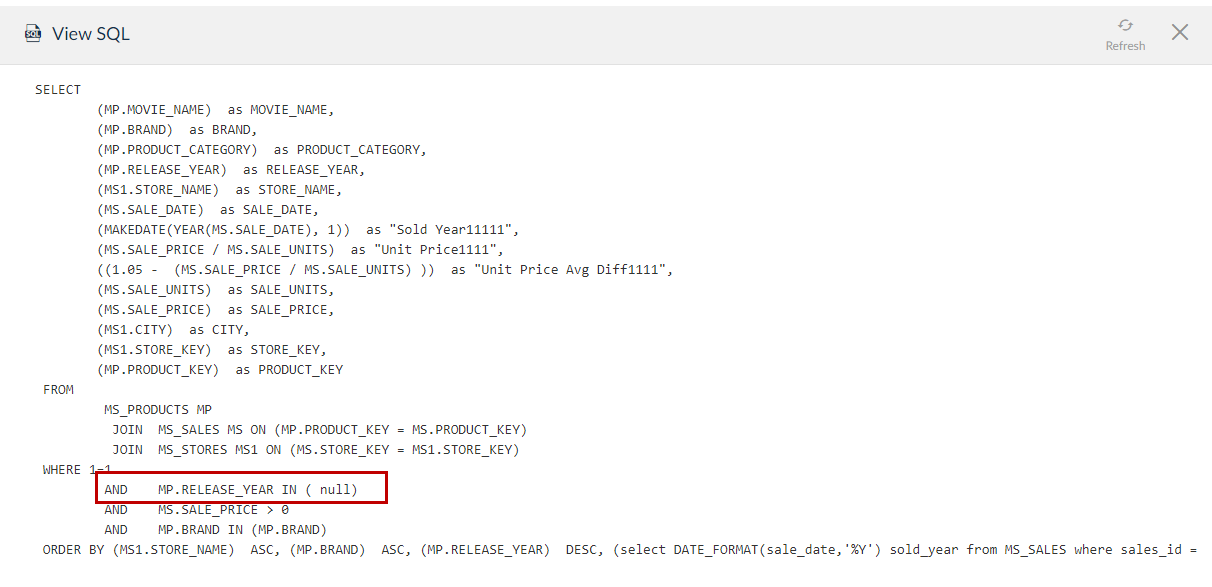
Since none of the filter values are selected, release year takes a NULL value.
The parameterized option will negate the null value even when there are no filters selected. Using parameterized option will load default values in the report as shown in the below image.
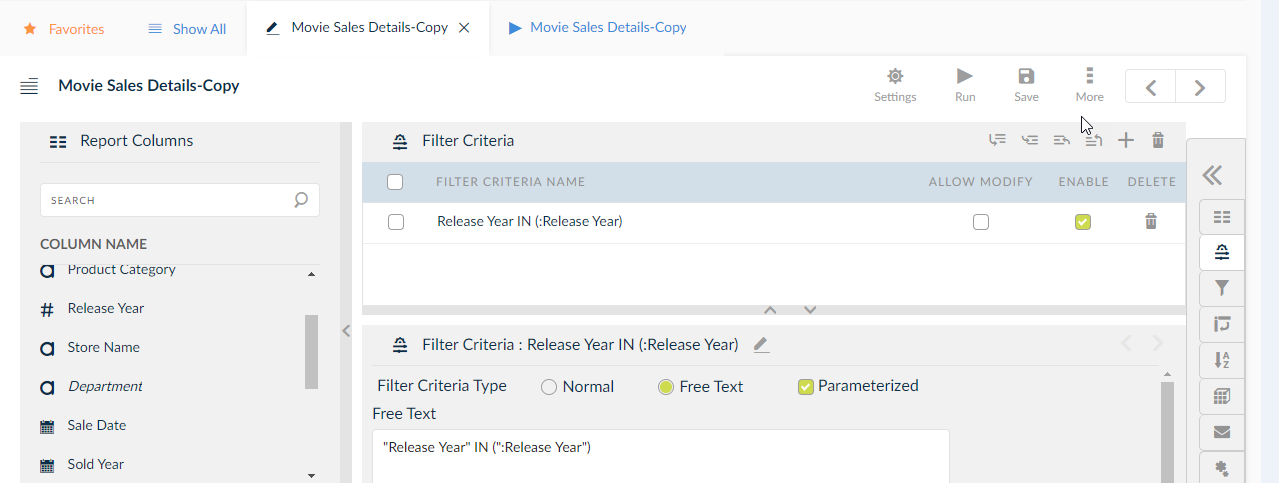

As observed, in the above images, even though the filter values are not selected, due to the Parameterized settings, SplashBI takes in default values.